Well, folks, XRP decided it was time for a little excitement, and boy, did it deliver! In the last 24 hours, the digital coin shot up by over 7%, bouncing back from a dramatic fall just last week. It moved from $2.37 to $2.59, adding a whopping $30 billion to its market cap. Not too shabby, right? 😎
Meanwhile, trading volume surged by 17%, hitting a cool $9.6 billion. Seems like the big buyers finally stopped sulking after that tariff-driven selloff, or maybe they just missed the party. Who knows? 🎉
Long-Term Pattern Points to Big Dreams (and Bigger Targets)
So, there’s this fancy chart that ChartNerd shared, showing XRP busting out of a multi-year triangle pattern that’s been brewing since 2018. Fast forward to late 2023, and it finally broke free, following a nice, smooth support path. I’d call it a ‘curveball,’ but that’s probably too much of a baseball reference for the crypto world.
According to the pattern, the price could eventually hit targets of $14 and $28. Those numbers are pulled from Fibonacci levels, the kind that sound impressive but don’t ask me to explain them to your grandmother. They’re basically magic numbers in the crypto world, and they say this thing’s got legs. 💰
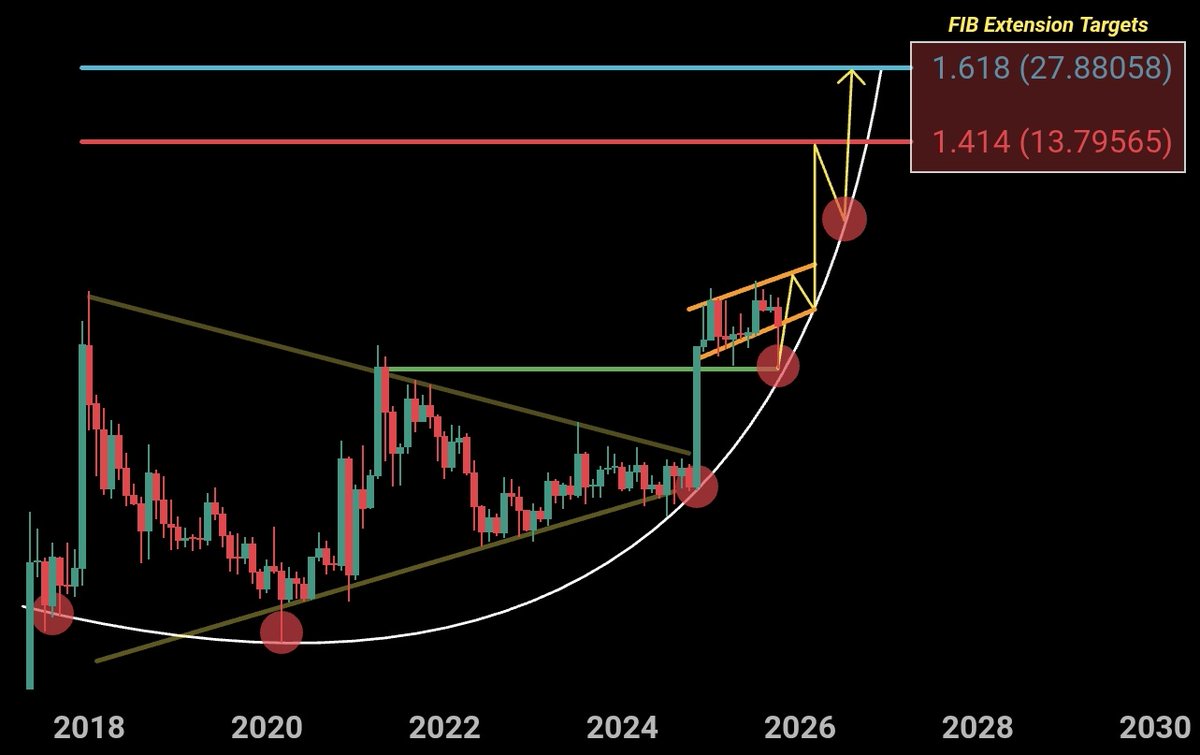
What’s even more interesting is the flag forming in 2024-2025. And no, it’s not a flag like the one you wave at a parade-this flag typically signals a pause before the trend picks up again. If XRP decides to break through it, we could be looking at a bigger rally sometime between 2026 and 2028. Talk about playing the long game! ⏳
Weekly Close Above Trendline-Is That Good?
To make matters even juicier, XRP closed last week above a key rising trendline that’s been holding since late 2024. This line’s been like that old friend who always shows up at the right time. You know, the dependable one. The trendline’s been providing support through several price swings-much like a safety net, but for rich people. 💸
CryptoBull chimed in with an excited tweet:
#XRP closed the week above year long uptrend. Extremely bullish!
– CryptoBull (@CryptoBull2020) October 13, 2025
The candle’s long lower wick suggests that buyers weren’t about to let this thing sink without a fight. A quick recovery, coupled with rising trading volume, might just be the start of a whole new chapter for XRP. Maybe it’s finally realized it’s not just another meme coin after all. 🚀
Short-Term Chart: Resistance Ahead (But Not Too Much)
On the 4-hour chart, XRP’s back above the 20 EMA, sitting pretty at $2.56. That’s showing some early signs of strength after the recent selloff. However, don’t pop the champagne just yet-it’s still below the 50 EMA ($2.69), the 100 EMA ($2.79), and the 200 EMA ($2.86). These moving averages are like those annoying obstacles in a video game. Get past them, and you’ve got a stronger recovery on your hands.
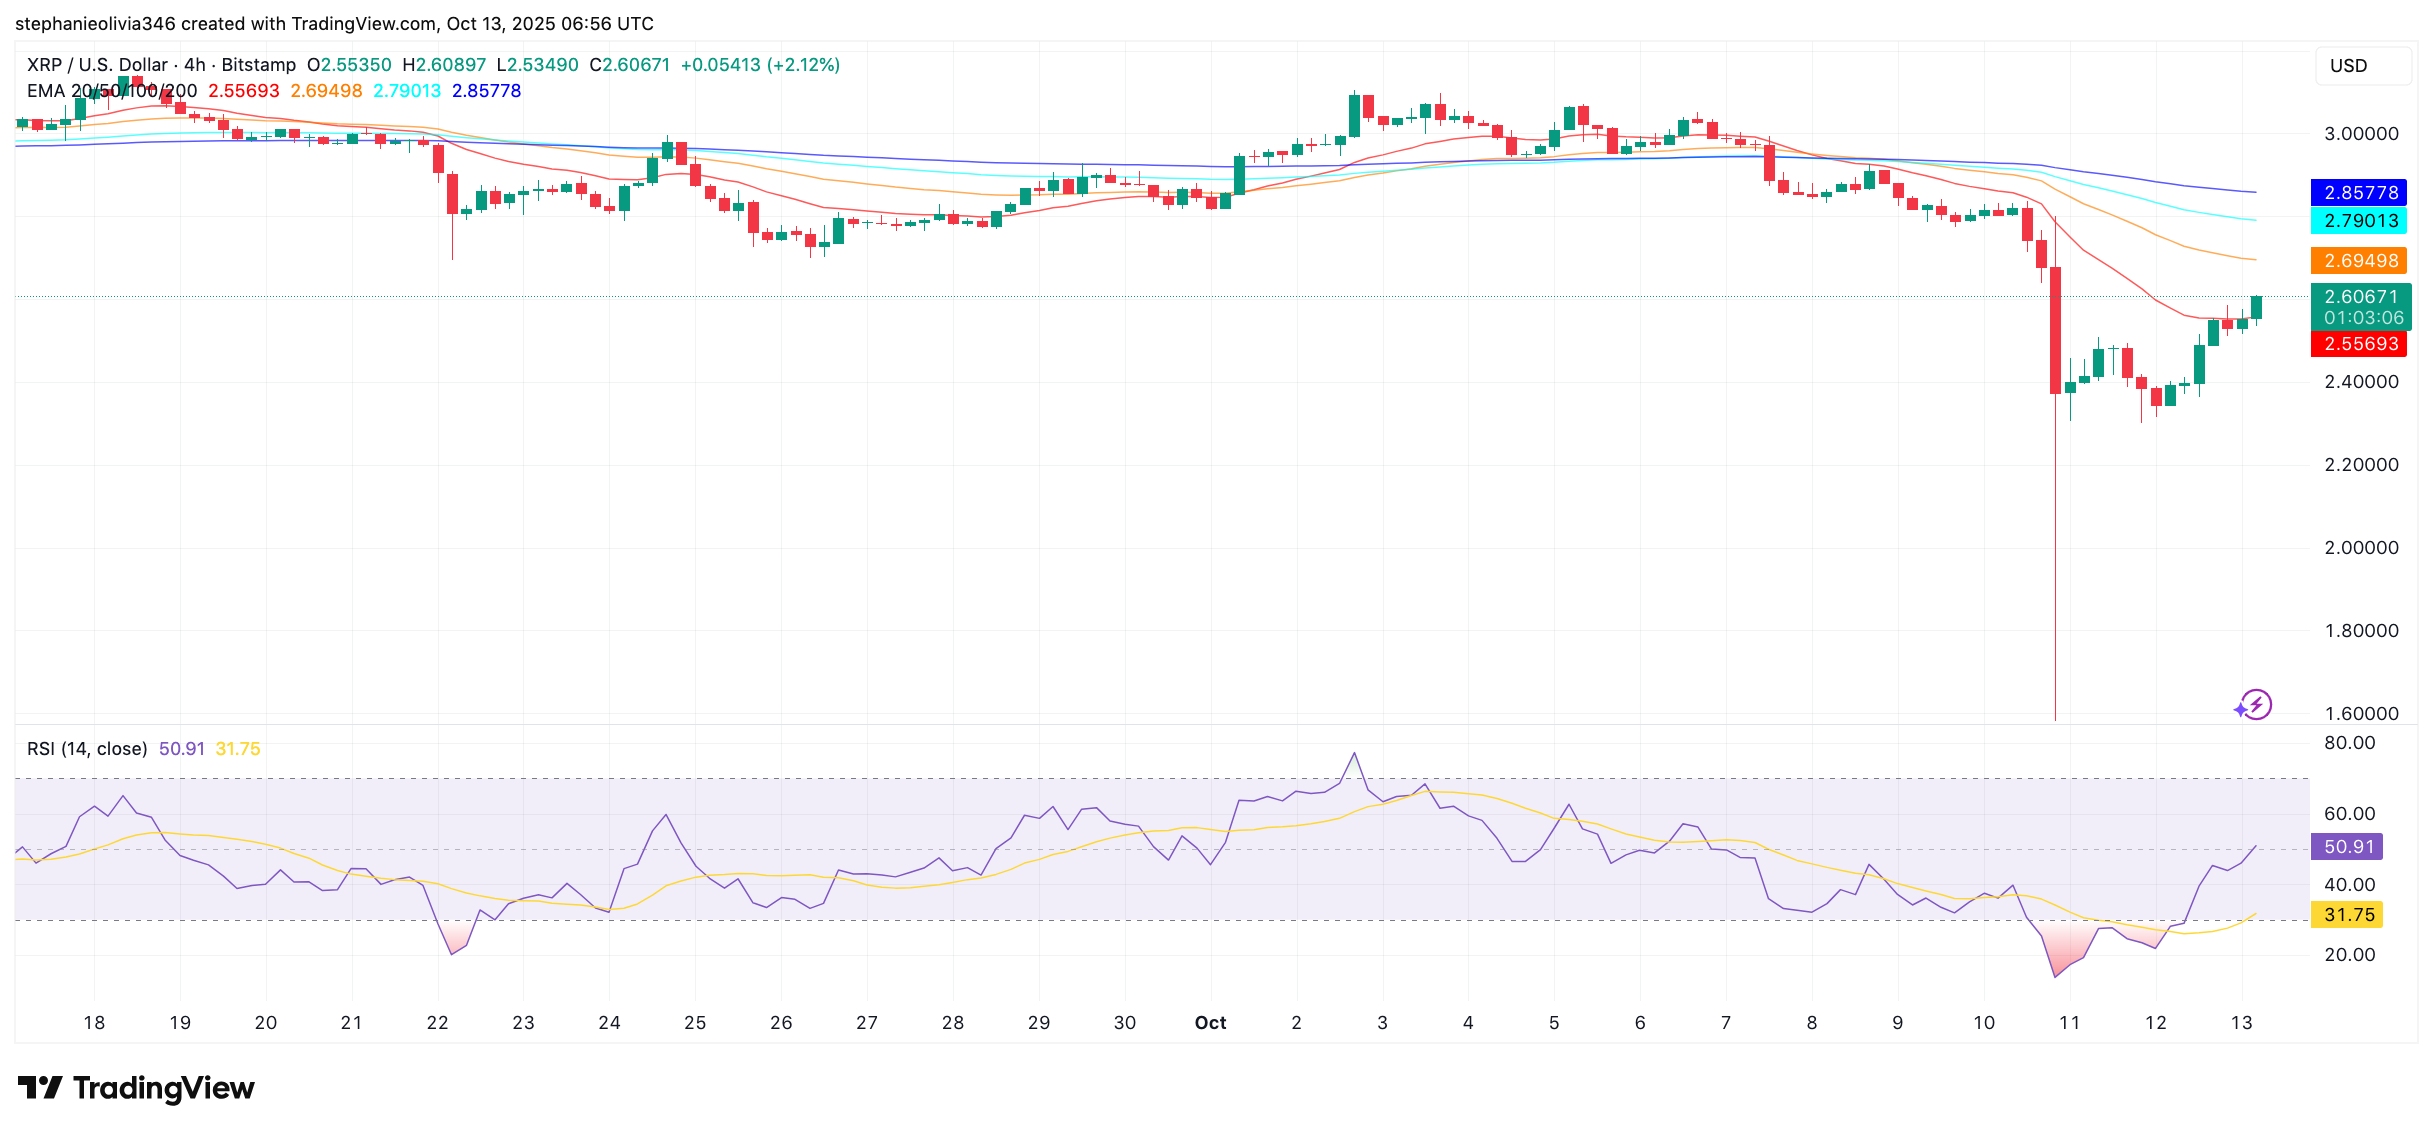
The Relative Strength Index (RSI) is currently sitting at 51-up from a low of 30 just two days ago. So, yeah, things are looking better. If XRP breaks through that resistance soon, the RSI might just keep climbing. But for now, it’s a little early to declare victory. The recovery’s been fast, though, and that’s definitely caught some eyes. 👀
Read More
- Gold Rate Forecast
- Brent Oil Forecast
- Silver Rate Forecast
- CNY JPY PREDICTION
- SPX PREDICTION. SPX cryptocurrency
- HBAR PREDICTION. HBAR cryptocurrency
- UK Adopts a Quixotic Crypto Quandary with BoE’s Capri-cious Stablecoin Strategy
- Oh My Goodness! Will PENGU Balloons to a Whopping 38%? Find Out Now! 🐧💥
- Winners & Whiners: PUMP Tokens Soar After Pump.Fun Grabs Padre, But Not Everyone’s Happy!
- HBAR: $32 Million Hangs in the Balance! 😲
2025-10-13 12:31