On November 8th, 2025, Bitcoin was wobbling about like a tipsy tightrope walker at $101,987-give or take a few thousand dollars-while the market cap ballooned to a whopping $2.03 trillion (that’s enough to buy a small moon). Trading volume? A casual $77.43 billion in 24 hours, because why not? The price danced between $99,376.95 and $103,956, like a nervous squirrel deciding whether to cross the road.
Bitcoin Chart Shenanigans
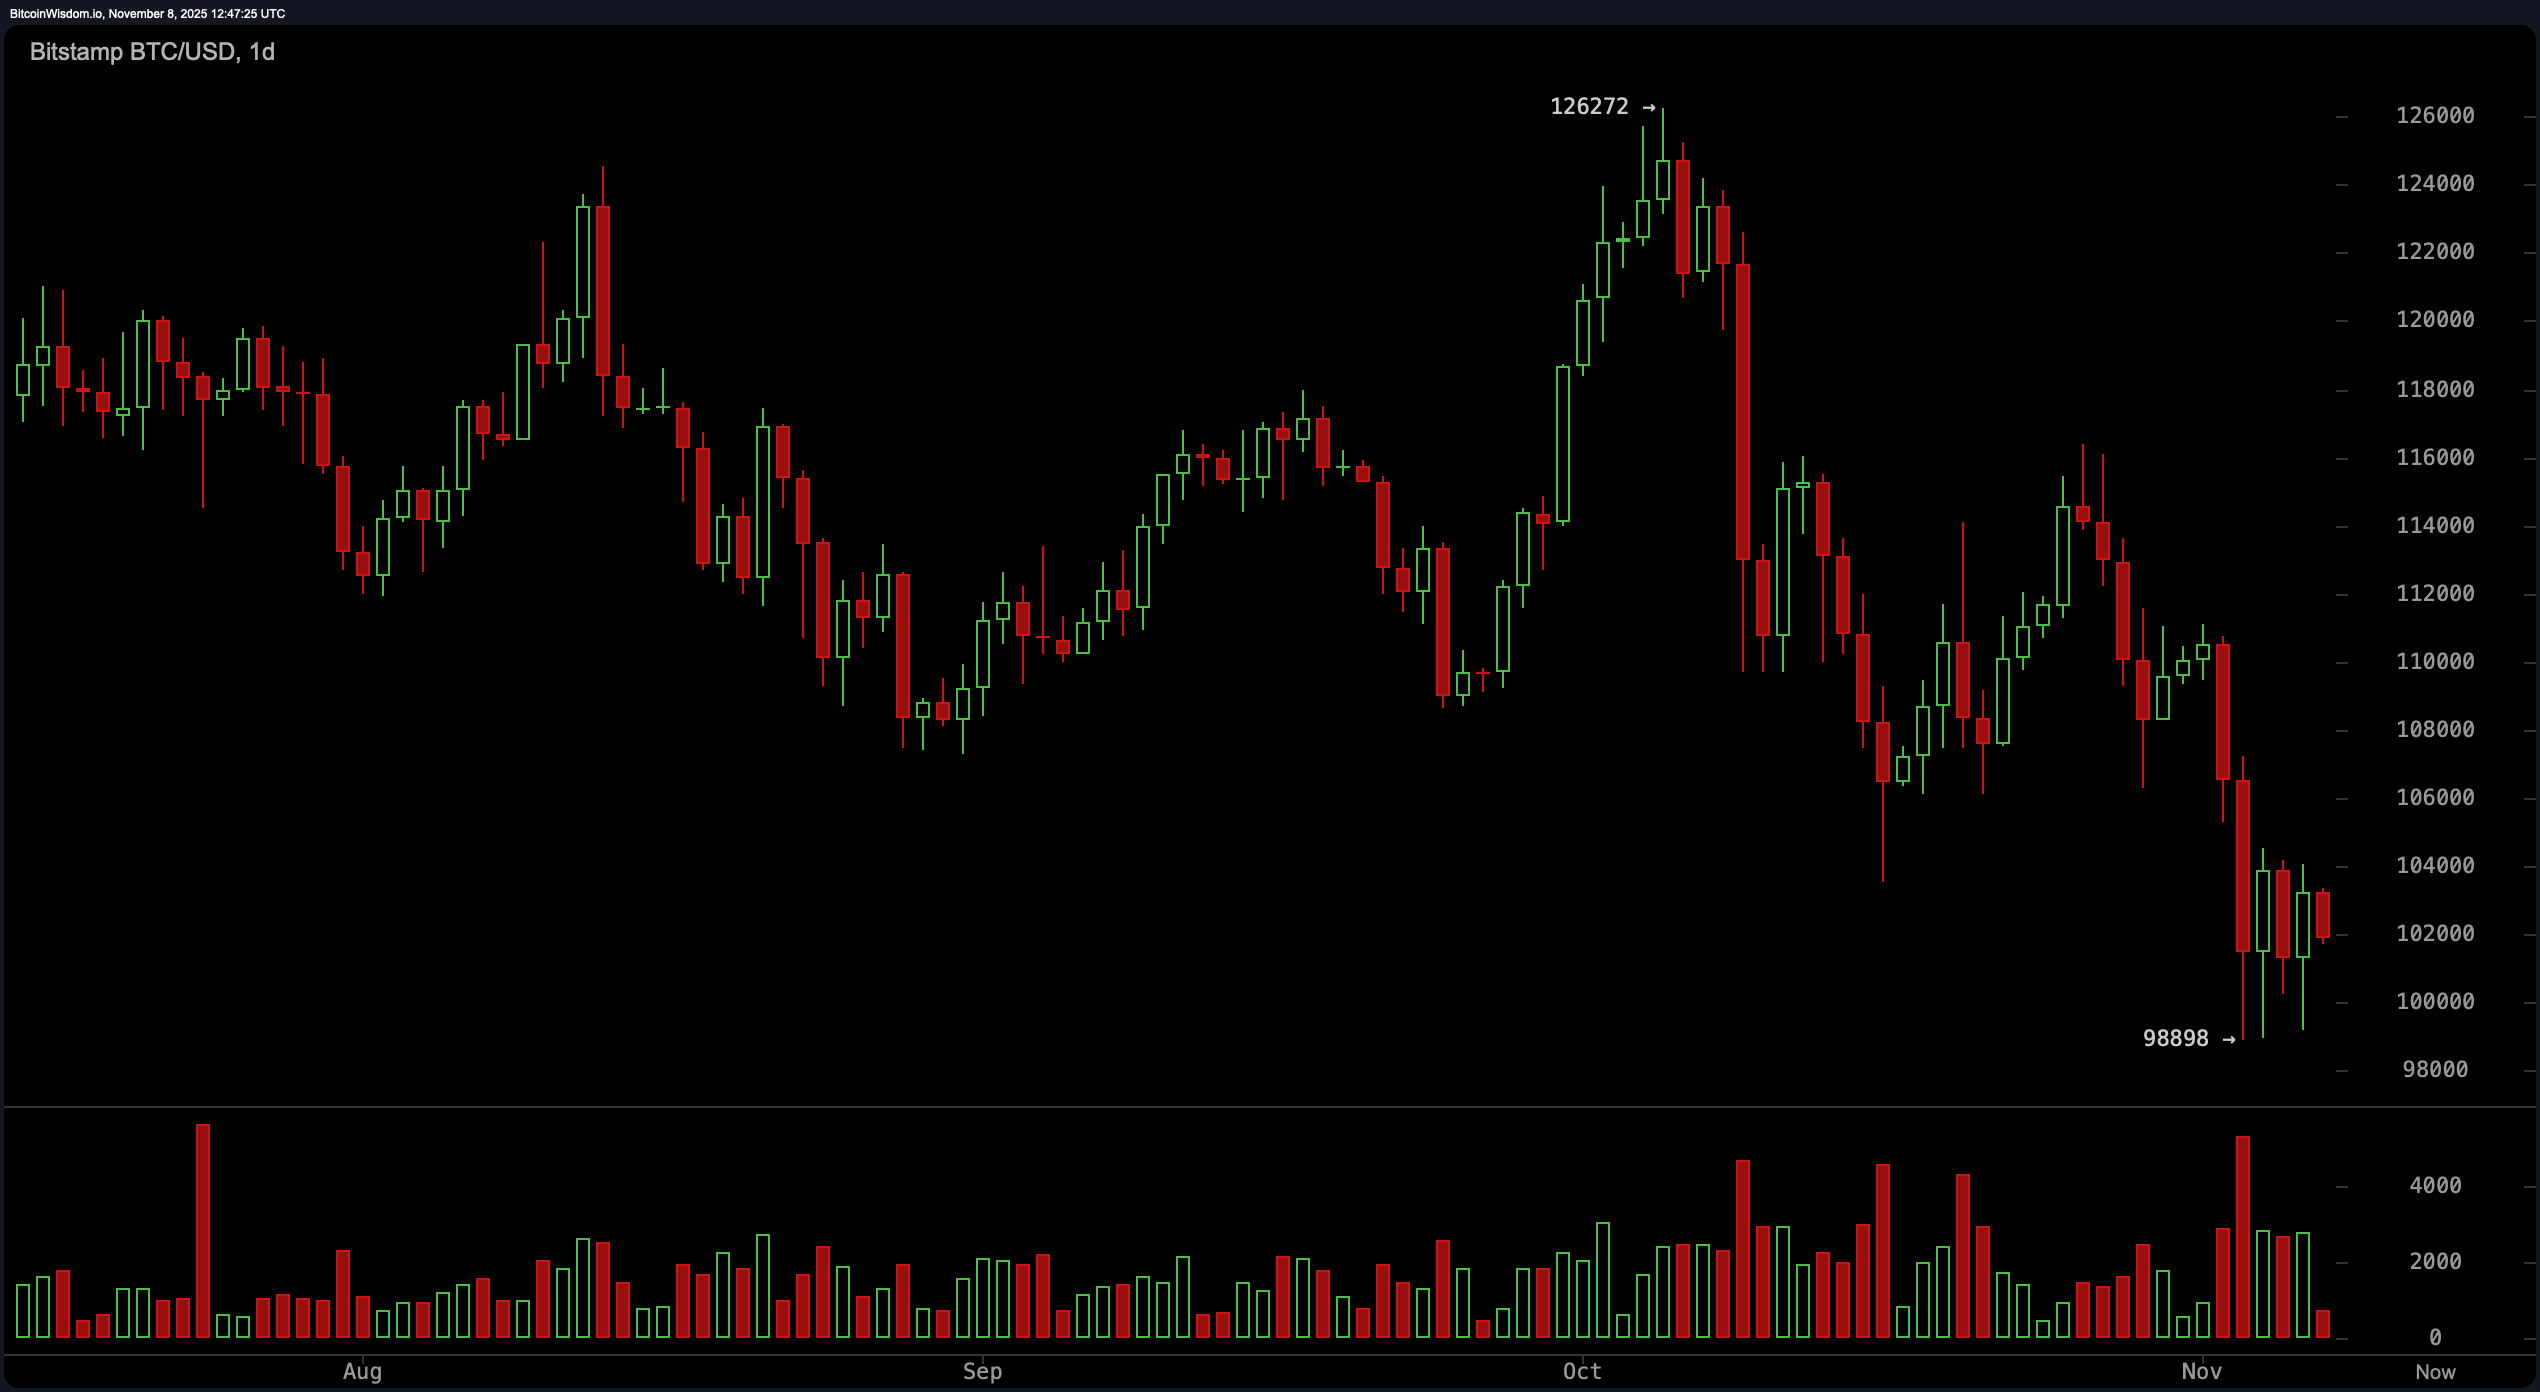
The daily chart looked like a rollercoaster designed by a sadist-Bitcoin had been sliding downhill since mid-October, when it peaked at $126,272 (cue the tiny violins). Now, it was stuck between $98,900 and $104,000, like a stubborn mule refusing to budge. Lower highs? Lower lows? Bears were having a picnic while bulls sharpened their horns.
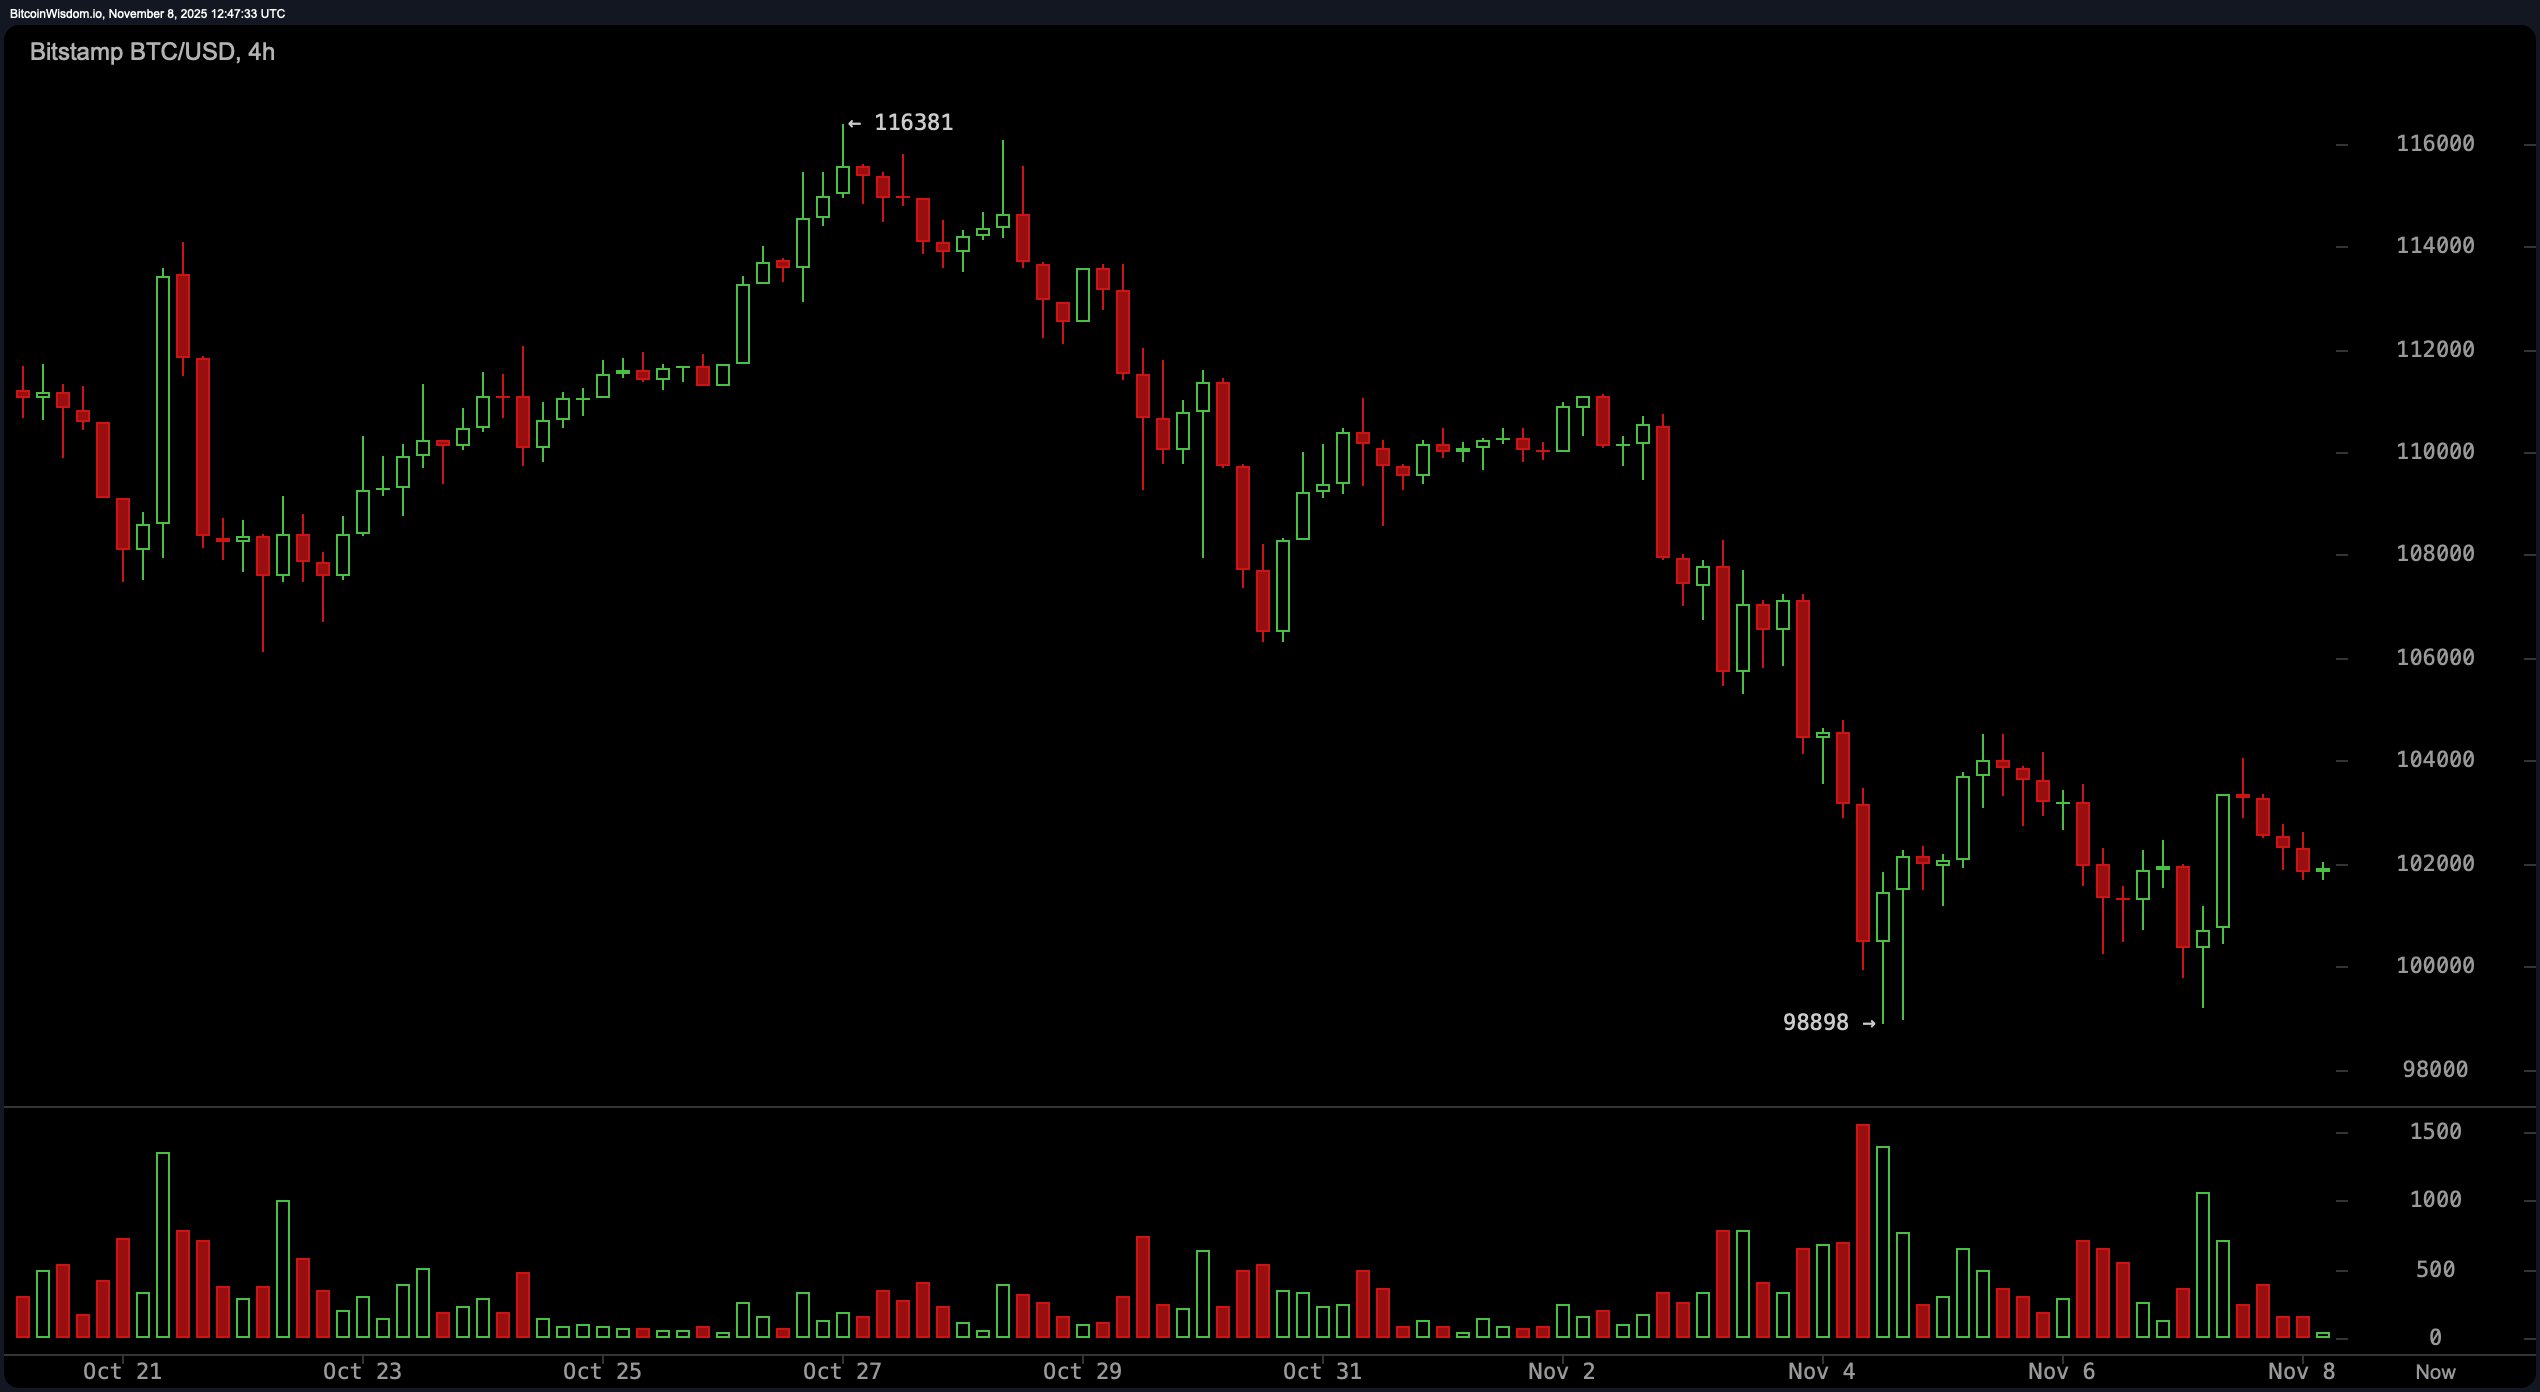
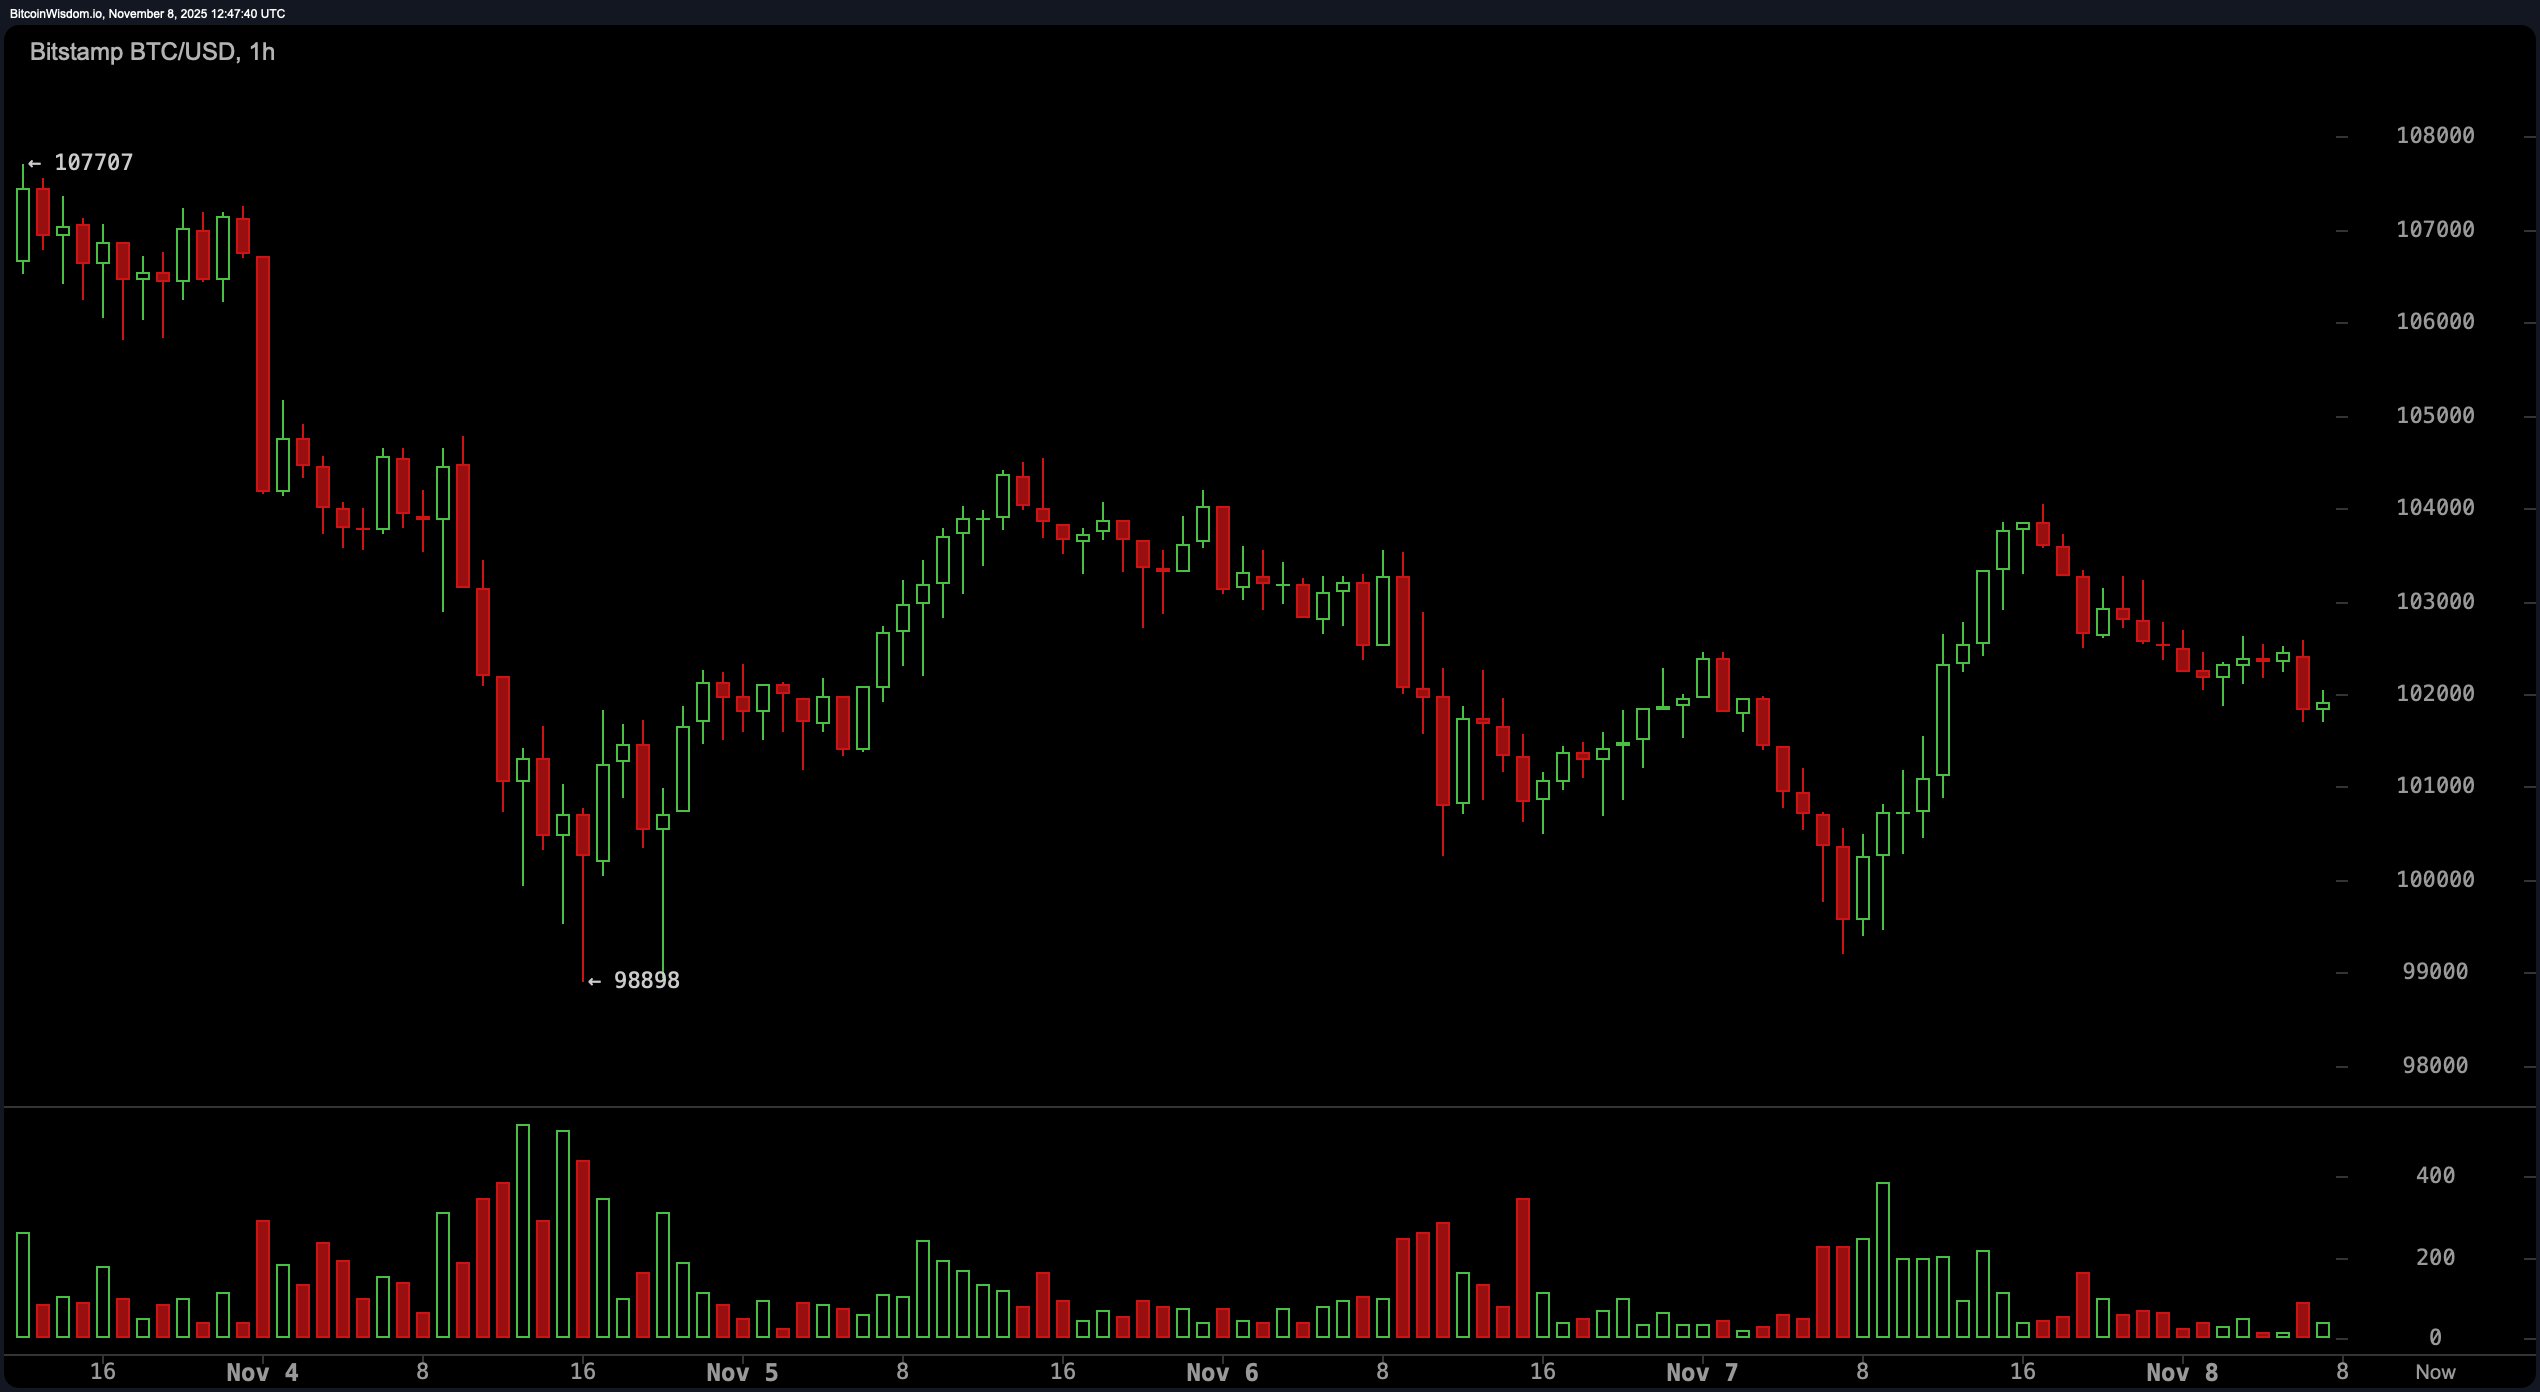
The four-hour chart was no better-multiple rejections near $104,000 (ouch!) and support around $98,900 (thank goodness for small mercies). The one-hour chart, however, showed a faint glimmer of hope-higher volume near $100,000, suggesting someone, somewhere, was quietly hoarding coins like a dragon with trust issues.
The oscillators were as indecisive as a toddler in a candy shop. RSI at 37? Neutral. Stochastic at 19? Also neutral. CCI at -125? “Eh, maybe?” Momentum at -8,178? “Could be worse!” MACD at -2,775? “Nope, still falling.” Awesome Oscillator at -8,789? “Not so awesome.” ADX at 25? “Just chilling.”
All the moving averages-EMAs, SMAs, you name it-were stacked above the price like a disapproving jury. The 10-period EMA ($105,102) and SMA ($105,674) sneered down, while the 200-period EMA ($108,101) and SMA ($110,249) loomed like strict schoolteachers. Bears were clearly in charge-unless, of course, Bitcoin decided to pull a fast one.
Volume surged near $98,900-was it panic selling or secret accumulation? Who knows! The market was as mysterious as a magician’s hat. Traders sat on their hands, waiting for a breakout like kids outside an ice cream truck.
Support at $98,900 was the last line of defense-if that broke, Bitcoin might tumble to $95,000 (or lower, if the bears got really greedy). Resistance at $104,000? Break that, and bulls might just start partying.
Bull Verdict: 🐂
If Bitcoin closes above $104,000 with gusto (and volume), bulls might finally get their moment. Push to $108,000? Then we’re talking. Otherwise, it’s just wishful thinking.
Bear Verdict: 🐻
If $98,900 cracks, brace yourselves-$95,000 (or worse) could be next. The moving averages are glaring, the trend is grumpy, and the bears are hungry.
FAQ (Because People Love Questions) ❓
- Where is Bitcoin trading now?
Around $101,987-stuck in limbo between $98,900 and $104,000. - What’s Bitcoin’s market cap?
A casual $2.03 trillion (no big deal). - What price levels matter?
$98,900 (support) and $104,000 (resistance)-pick your side. - Bullish or bearish?
Right now? Bears are winning. But surprises happen.
Read More
- Gold Rate Forecast
- Brent Oil Forecast
- SUI PREDICTION. SUI cryptocurrency
- Chainlink Soars, BNB Chain Joins the Party! What’s Next for LINK?
- SOL’s Sky-High Gambit: ETF Dreams or a Crypto Mirage?
- 🚀 Solana’s November: Bull Run or Bull Plop? 🌽
- STRK Skyrockets: Bitcoin Staking Turns Starknet into a Circus of Gains! 🎢💰
- Silver Rate Forecast
- Ethereum’s Descent: $7.5B Portfolio In The Red! 😭📉
- Ripple’s XRP: Banking’s New BFF or Just a Blockchain Facade? 🤔💰
2025-11-08 17:28