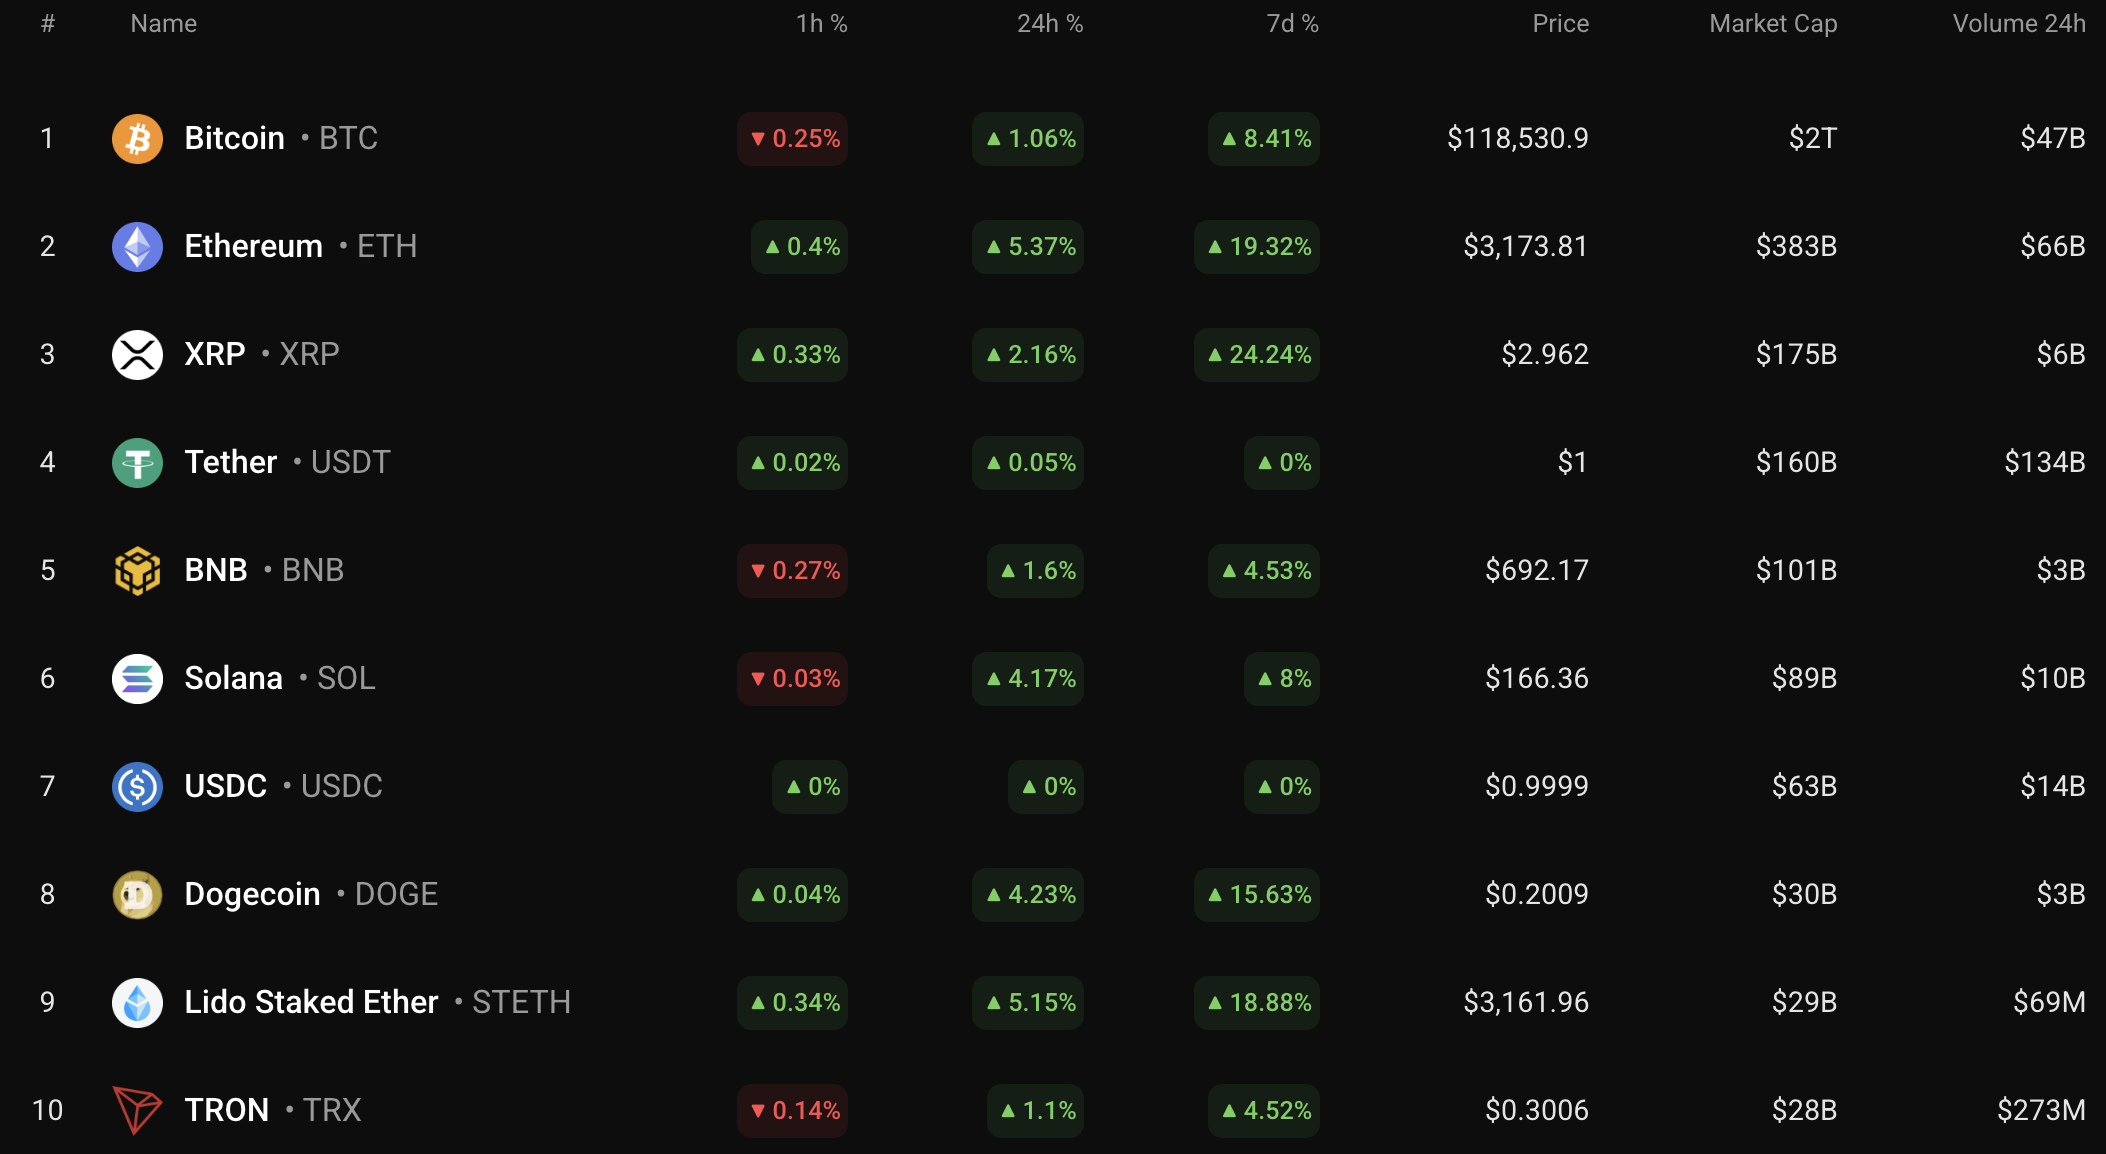
The correction has not lasted long, and all of the top 10 coins are in the green zone again, according to CoinStats.
BTC/USD
The rate of Bitcoin (BTC) has increased by 1.06% since yesterday.
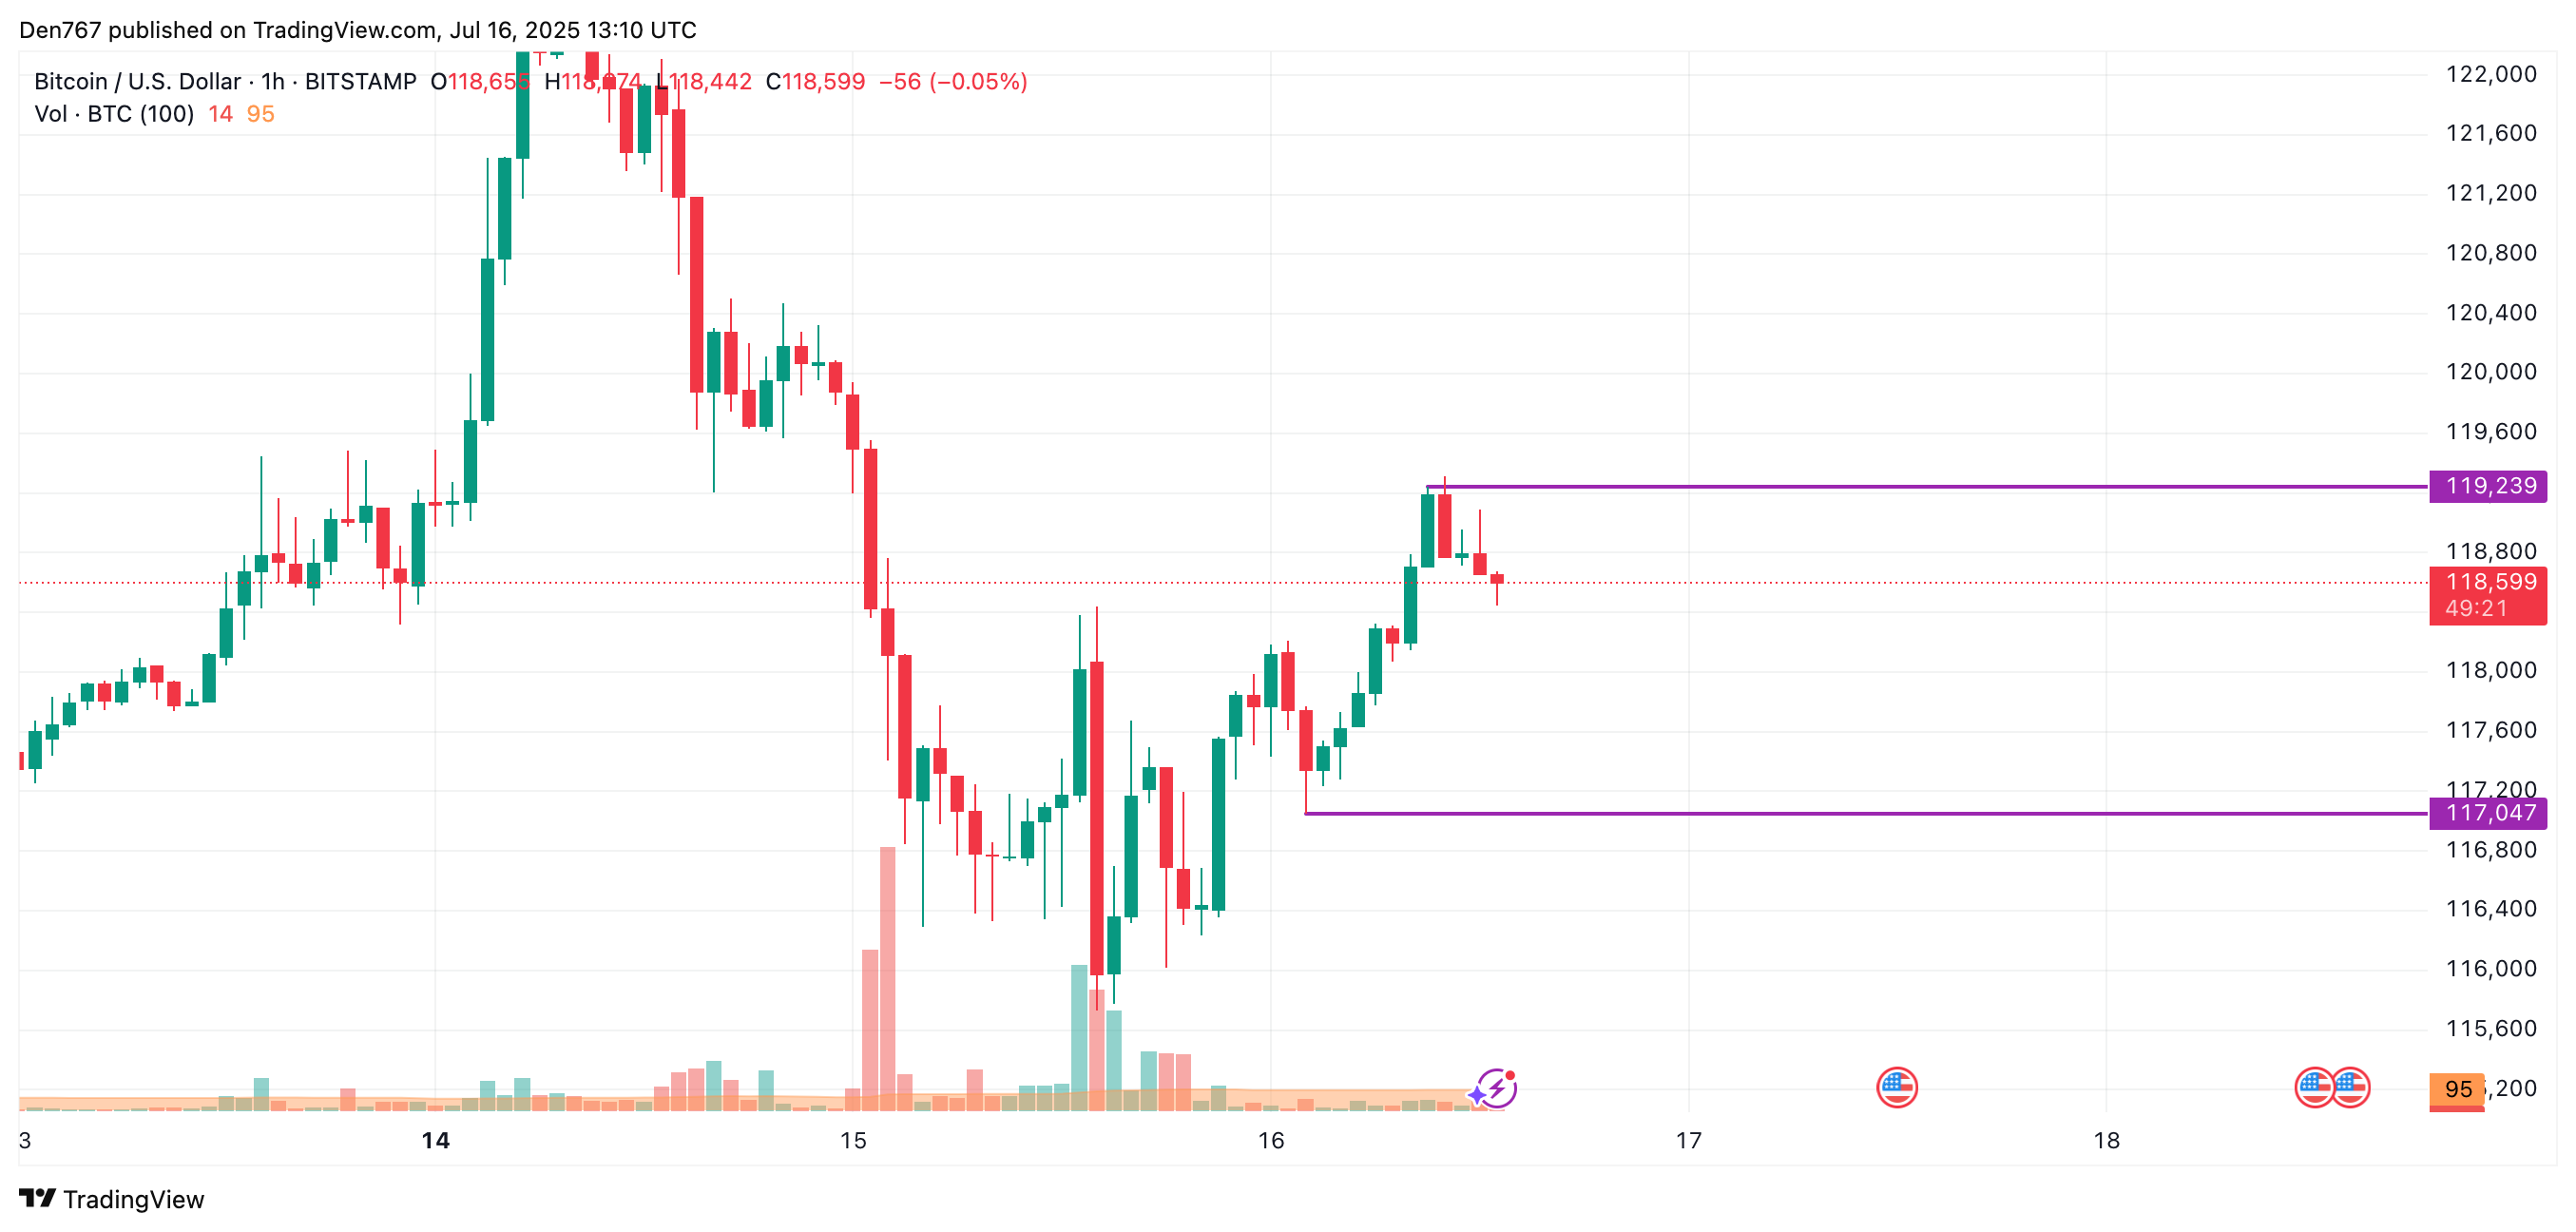
On the hourly chart, the price of BTC has made a false breakout of the local resistance of $119,239. However, if the daily bar closes near that mark, one can expect a test of the $120,000 area soon.
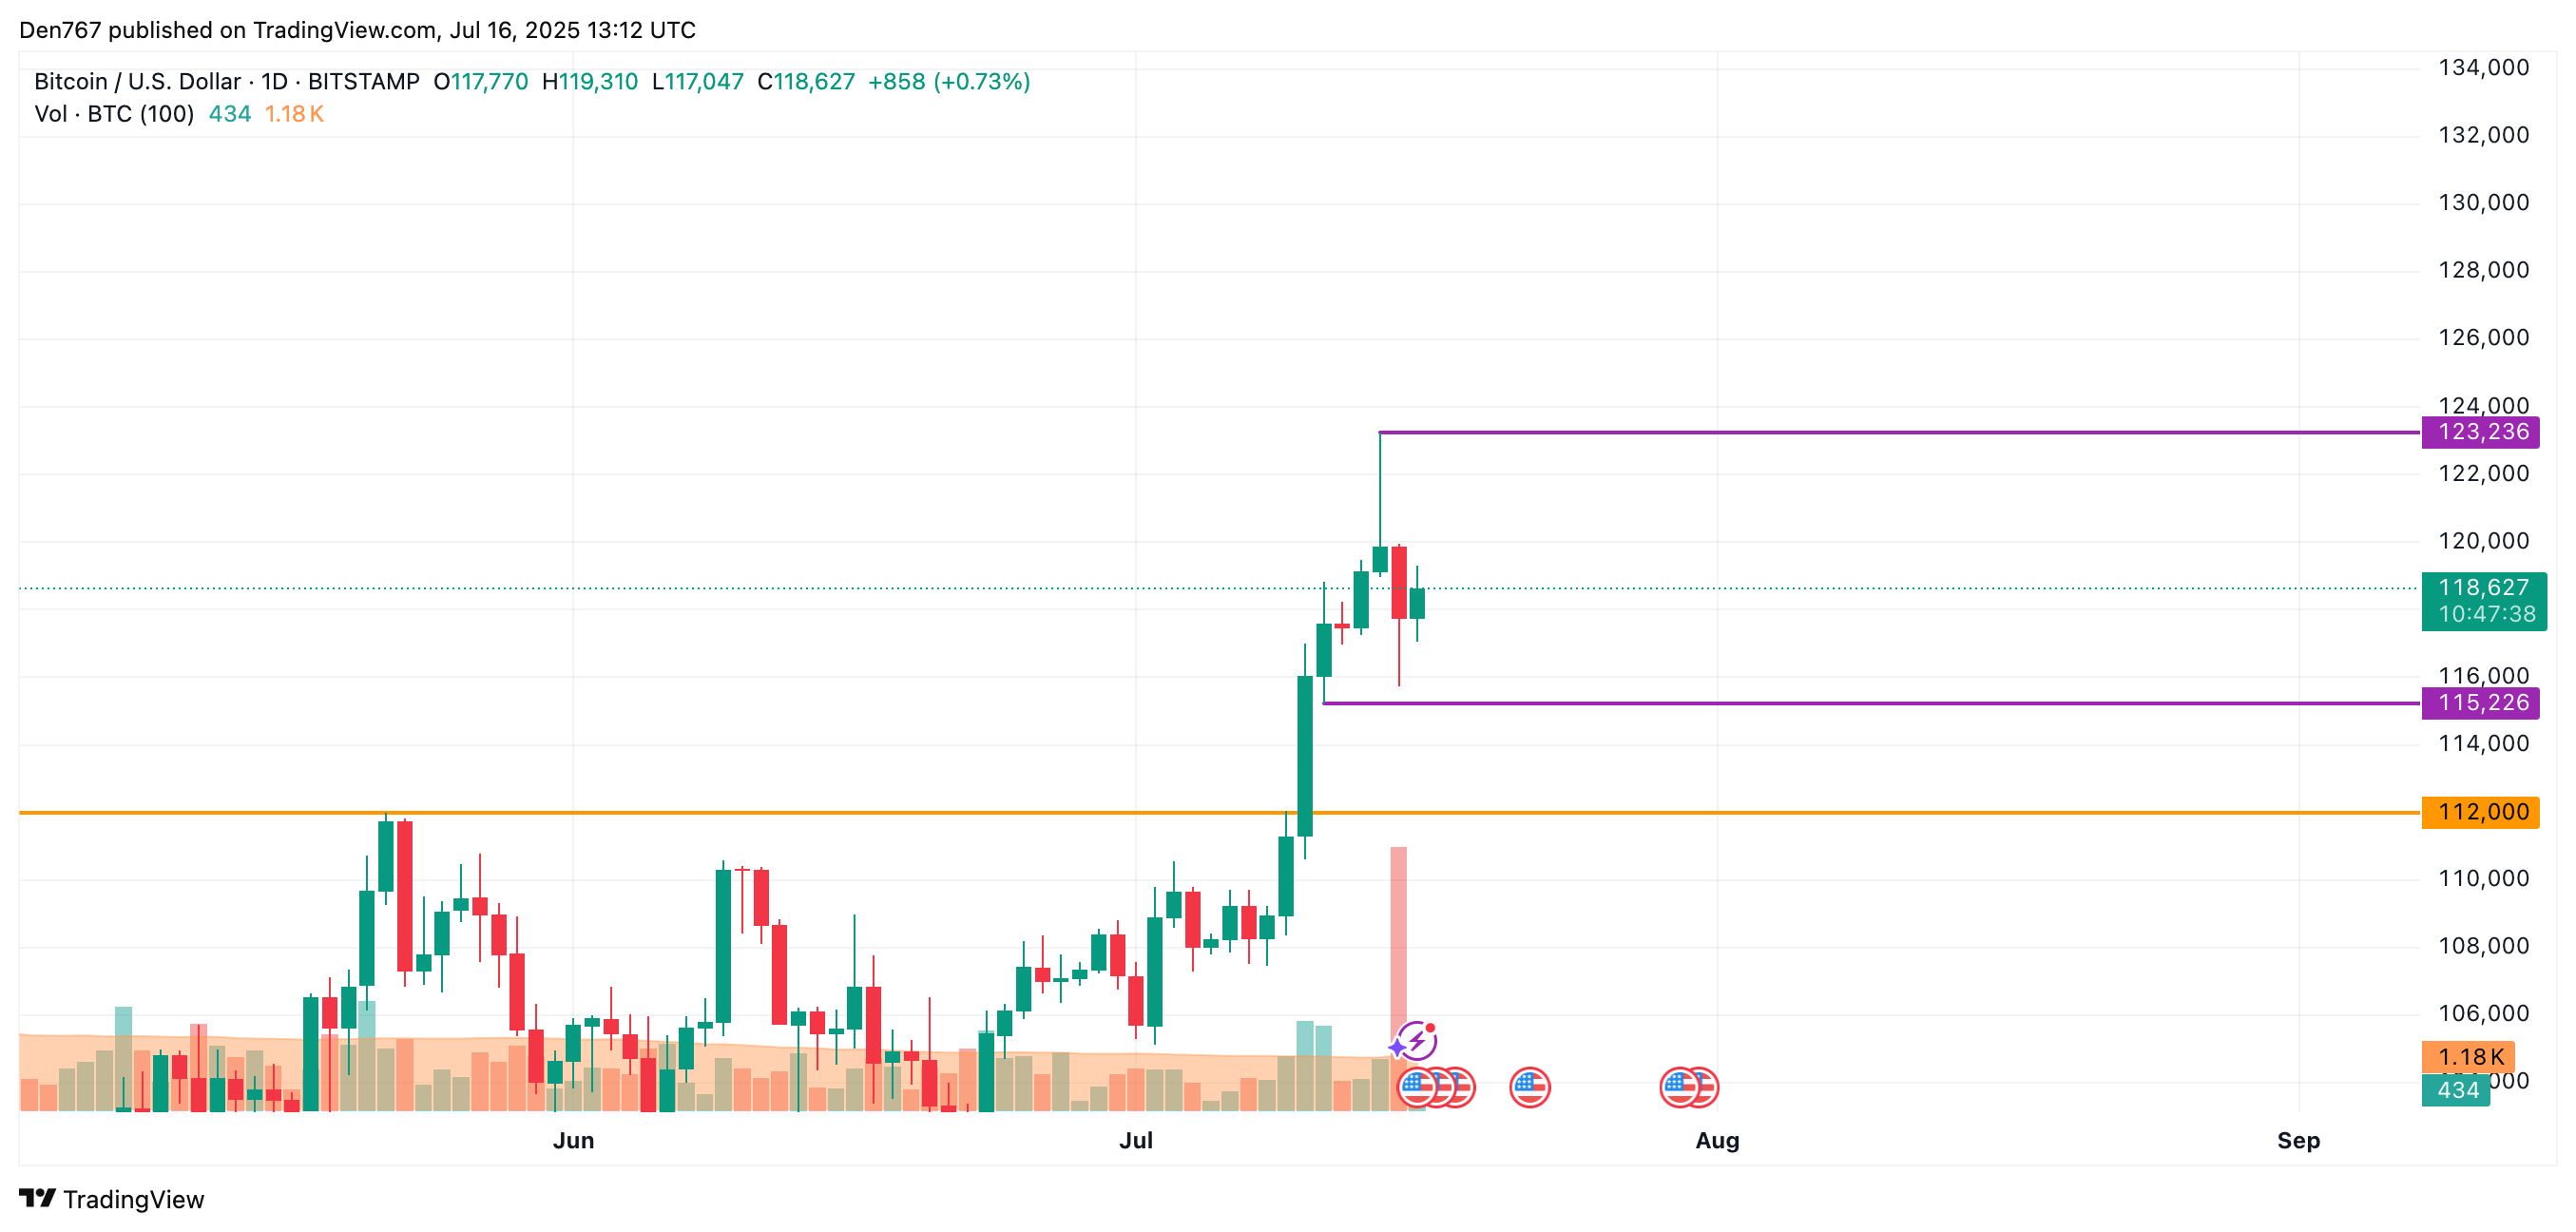
On the daily time frame, the rate of the main crypto is within yesterday’s candle, which means none of the sides is dominating.
Thus, the volume is going down, confirming the absence of bulls and bears’ strength. In this regard, consolidation in the range of $117,000-$120,000 is the most likely scenario.
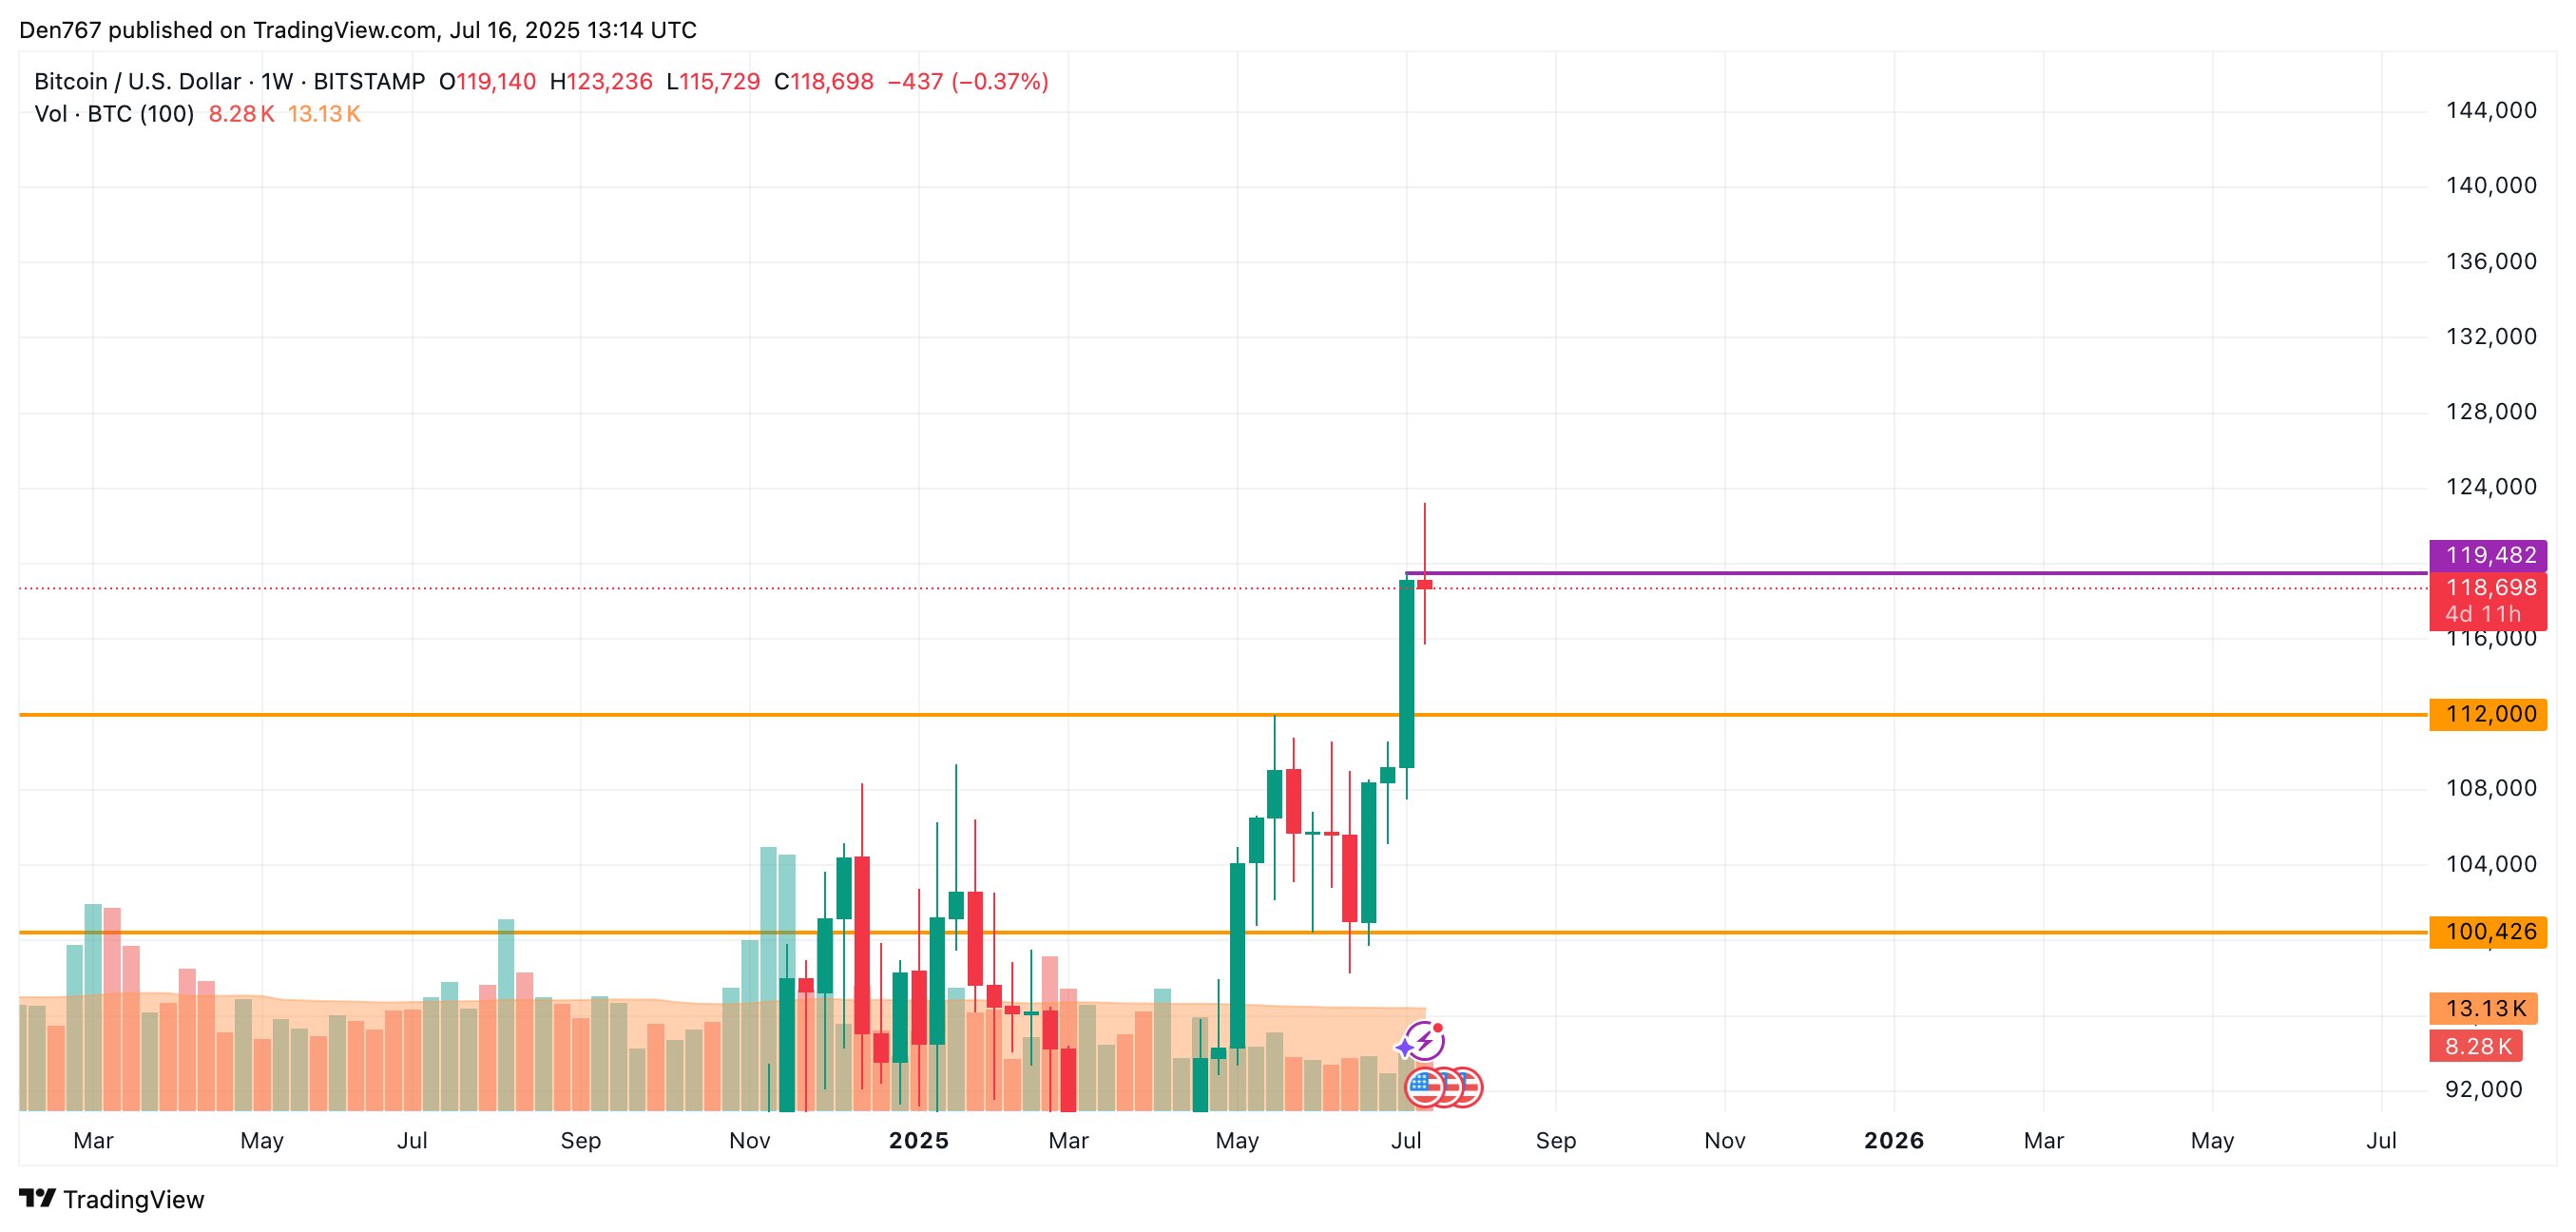
From the midterm point of view, one should focus on the weekly bar closure in terms of the $119,482 level. If the candle closes far from it, sellers may seize the initiative, which may lead to a correction to the $112,000 mark.
Bitcoin is trading at $118,698 at press time.
Read More
- Gold Rate Forecast
- TRUMP PREDICTION. TRUMP cryptocurrency
- Brent Oil Forecast
- Silver Rate Forecast
- USD CNY PREDICTION
- Ethereum’s $4K Comeback: A Tale of Desperation and ETF Tears 🚨
- XRP Price Tale: The River That Rises
- 🚀 BNB Soars to the Moon While Crypto Market Faceplants! 🌕💸
- Solana Whales Dance: ETF Drama & $210’s Fatal Attraction! 🐳💸
- Bitcoin Takes a Nosedive, Heads for Uplift? 😱📈
2025-07-16 18:32