Bitcoin, the digital currency that’s as unpredictable as a cat on a hot tin roof, managed to cling onto a narrow trading band at the start of the month. It’s currently hanging tough above the crucial support level of $107,000, but it’s got a bit of a mountain to climb to push past the stubborn resistance around $112,000-$114,000. If you’re looking at the technical charts, they’re telling us that things are a bit of a muddle, with a tilt towards consolidation and a whisper of bearishness, thanks to those pesky oscillators and moving averages across the 1-hour, 4-hour, and daily charts.
Bitcoin
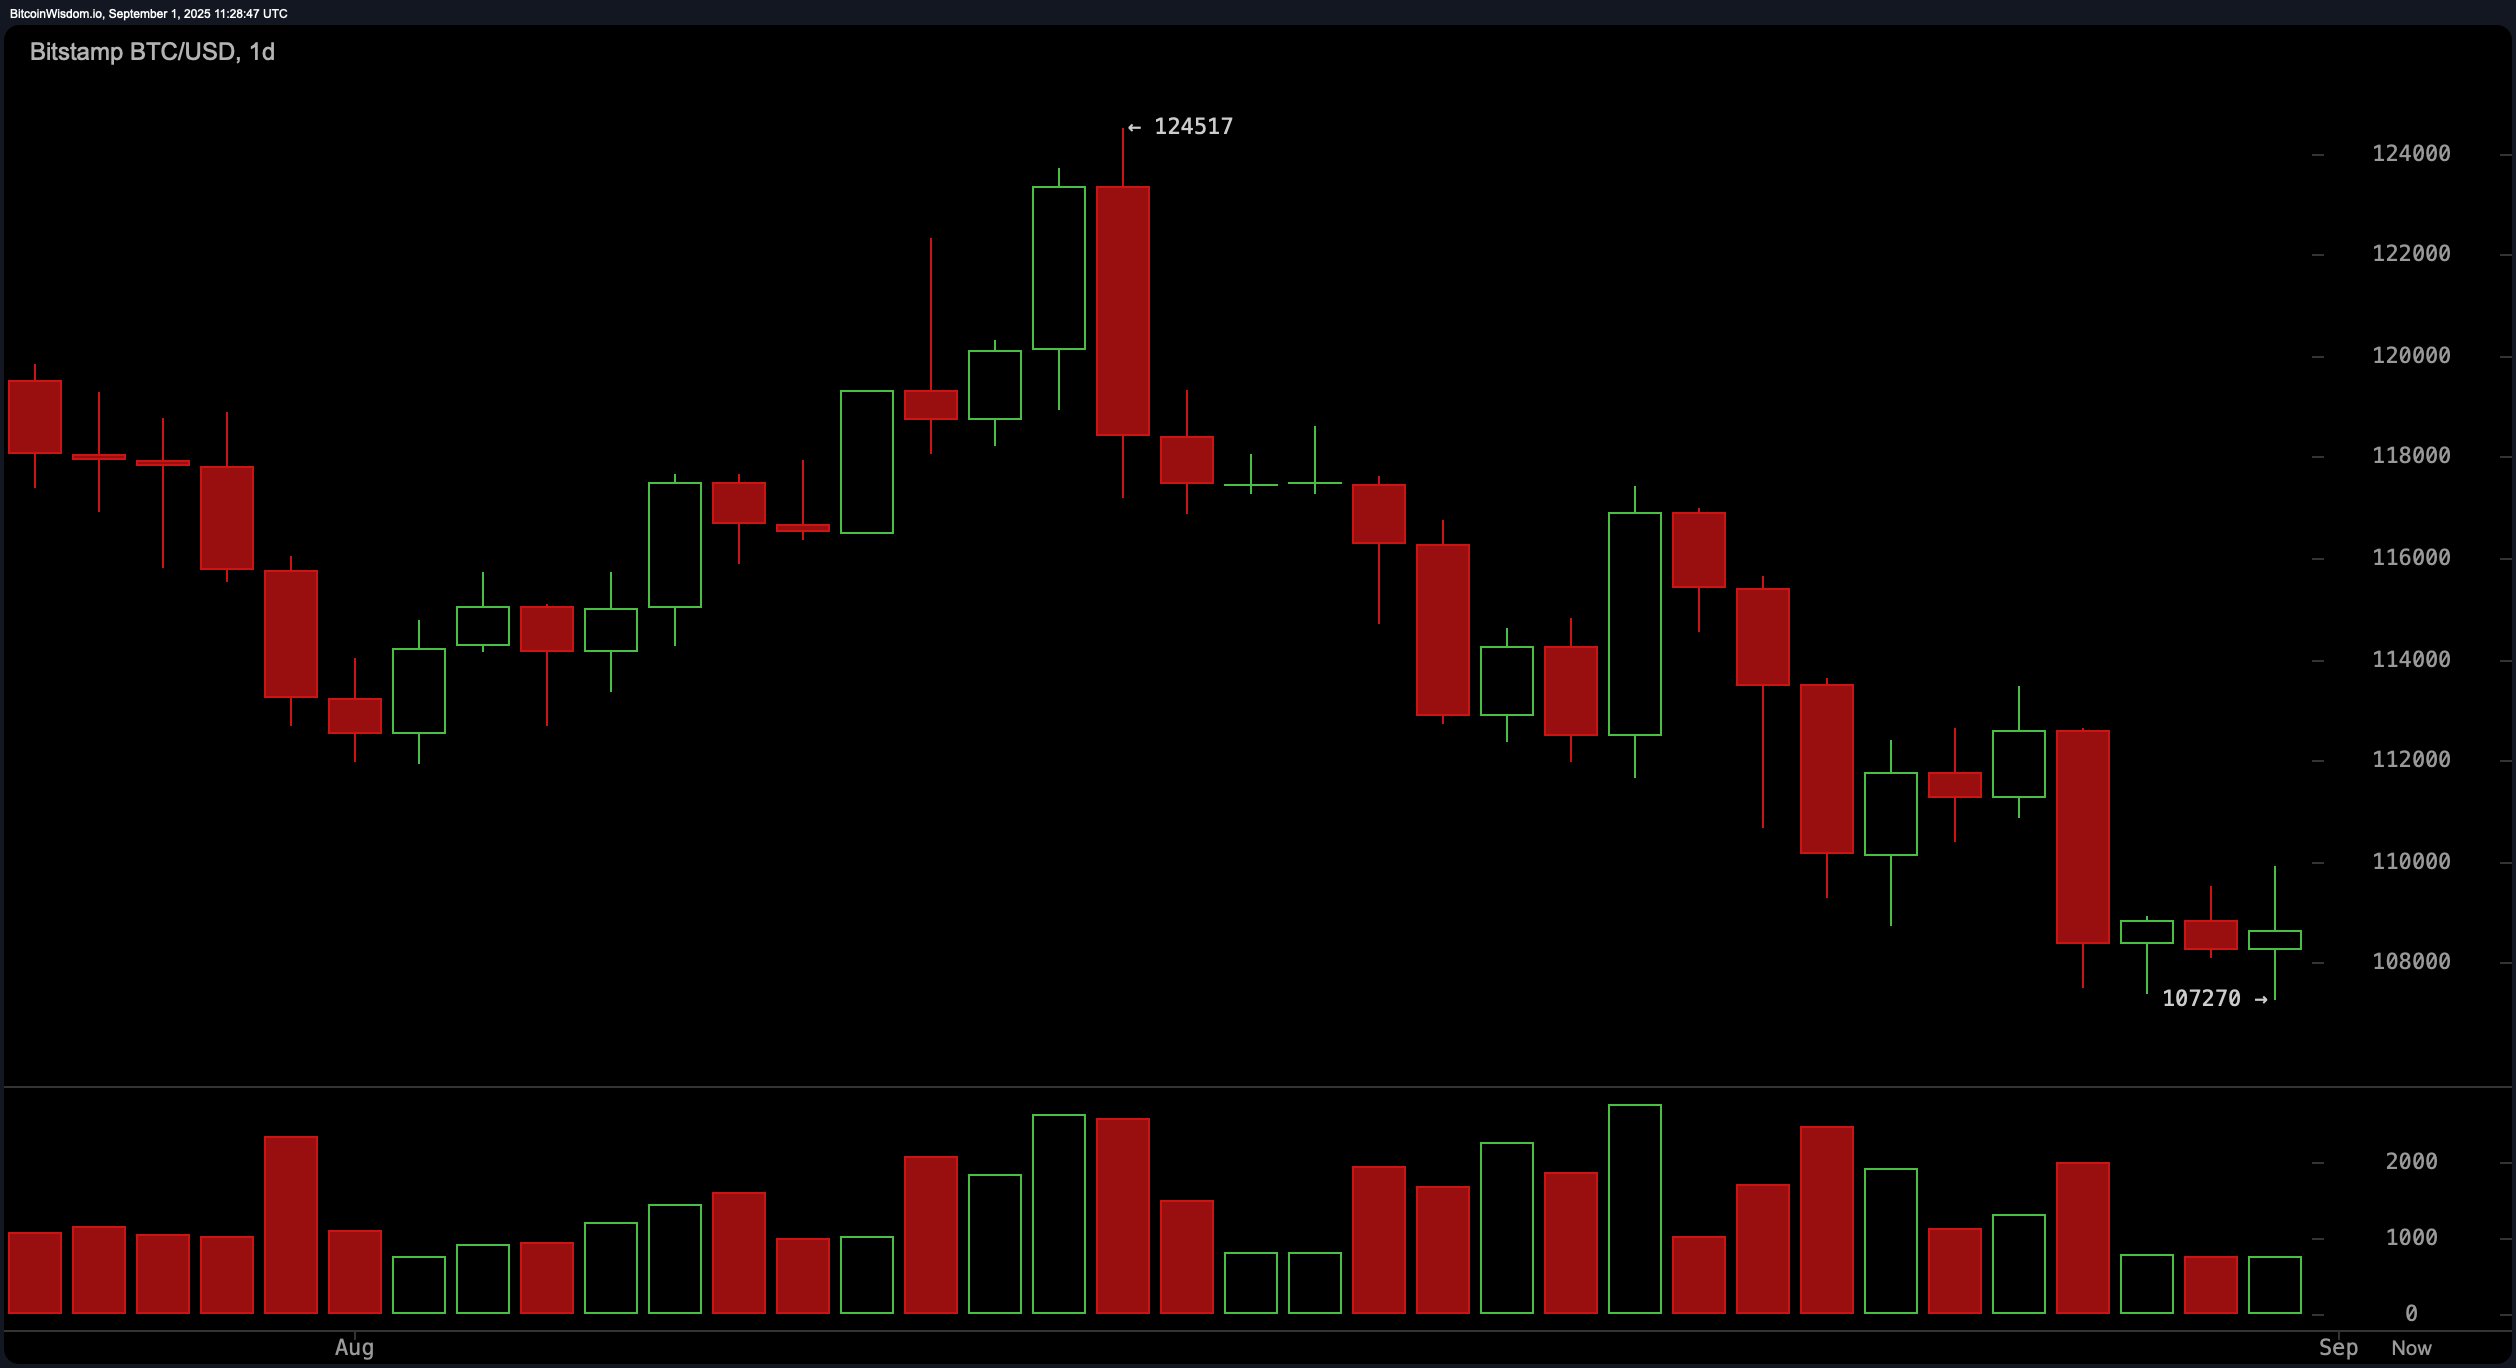
On the daily chart, bitcoin is like a knight on a quest, navigating a clear downtrend from a lofty peak of about $124,500 to a rather more modest $107,270. This journey has carved out a pattern of lower highs and lower lows, which, for those who speak the language of charts, confirms a short-term bearish trend. Despite a valiant effort to bounce back, the price stumbled near $112,000, making it clear that this level is a fortress of resistance. The red candles with elevated volume are a bit of a giveaway, showing that the bears are still in control. If the $107,000 area gives way, it might just be the gateway to a trip down to $104,000. But until we see a solid bounce above $110,000 with some serious volume, the mood remains cautiously skeptical. 🤔
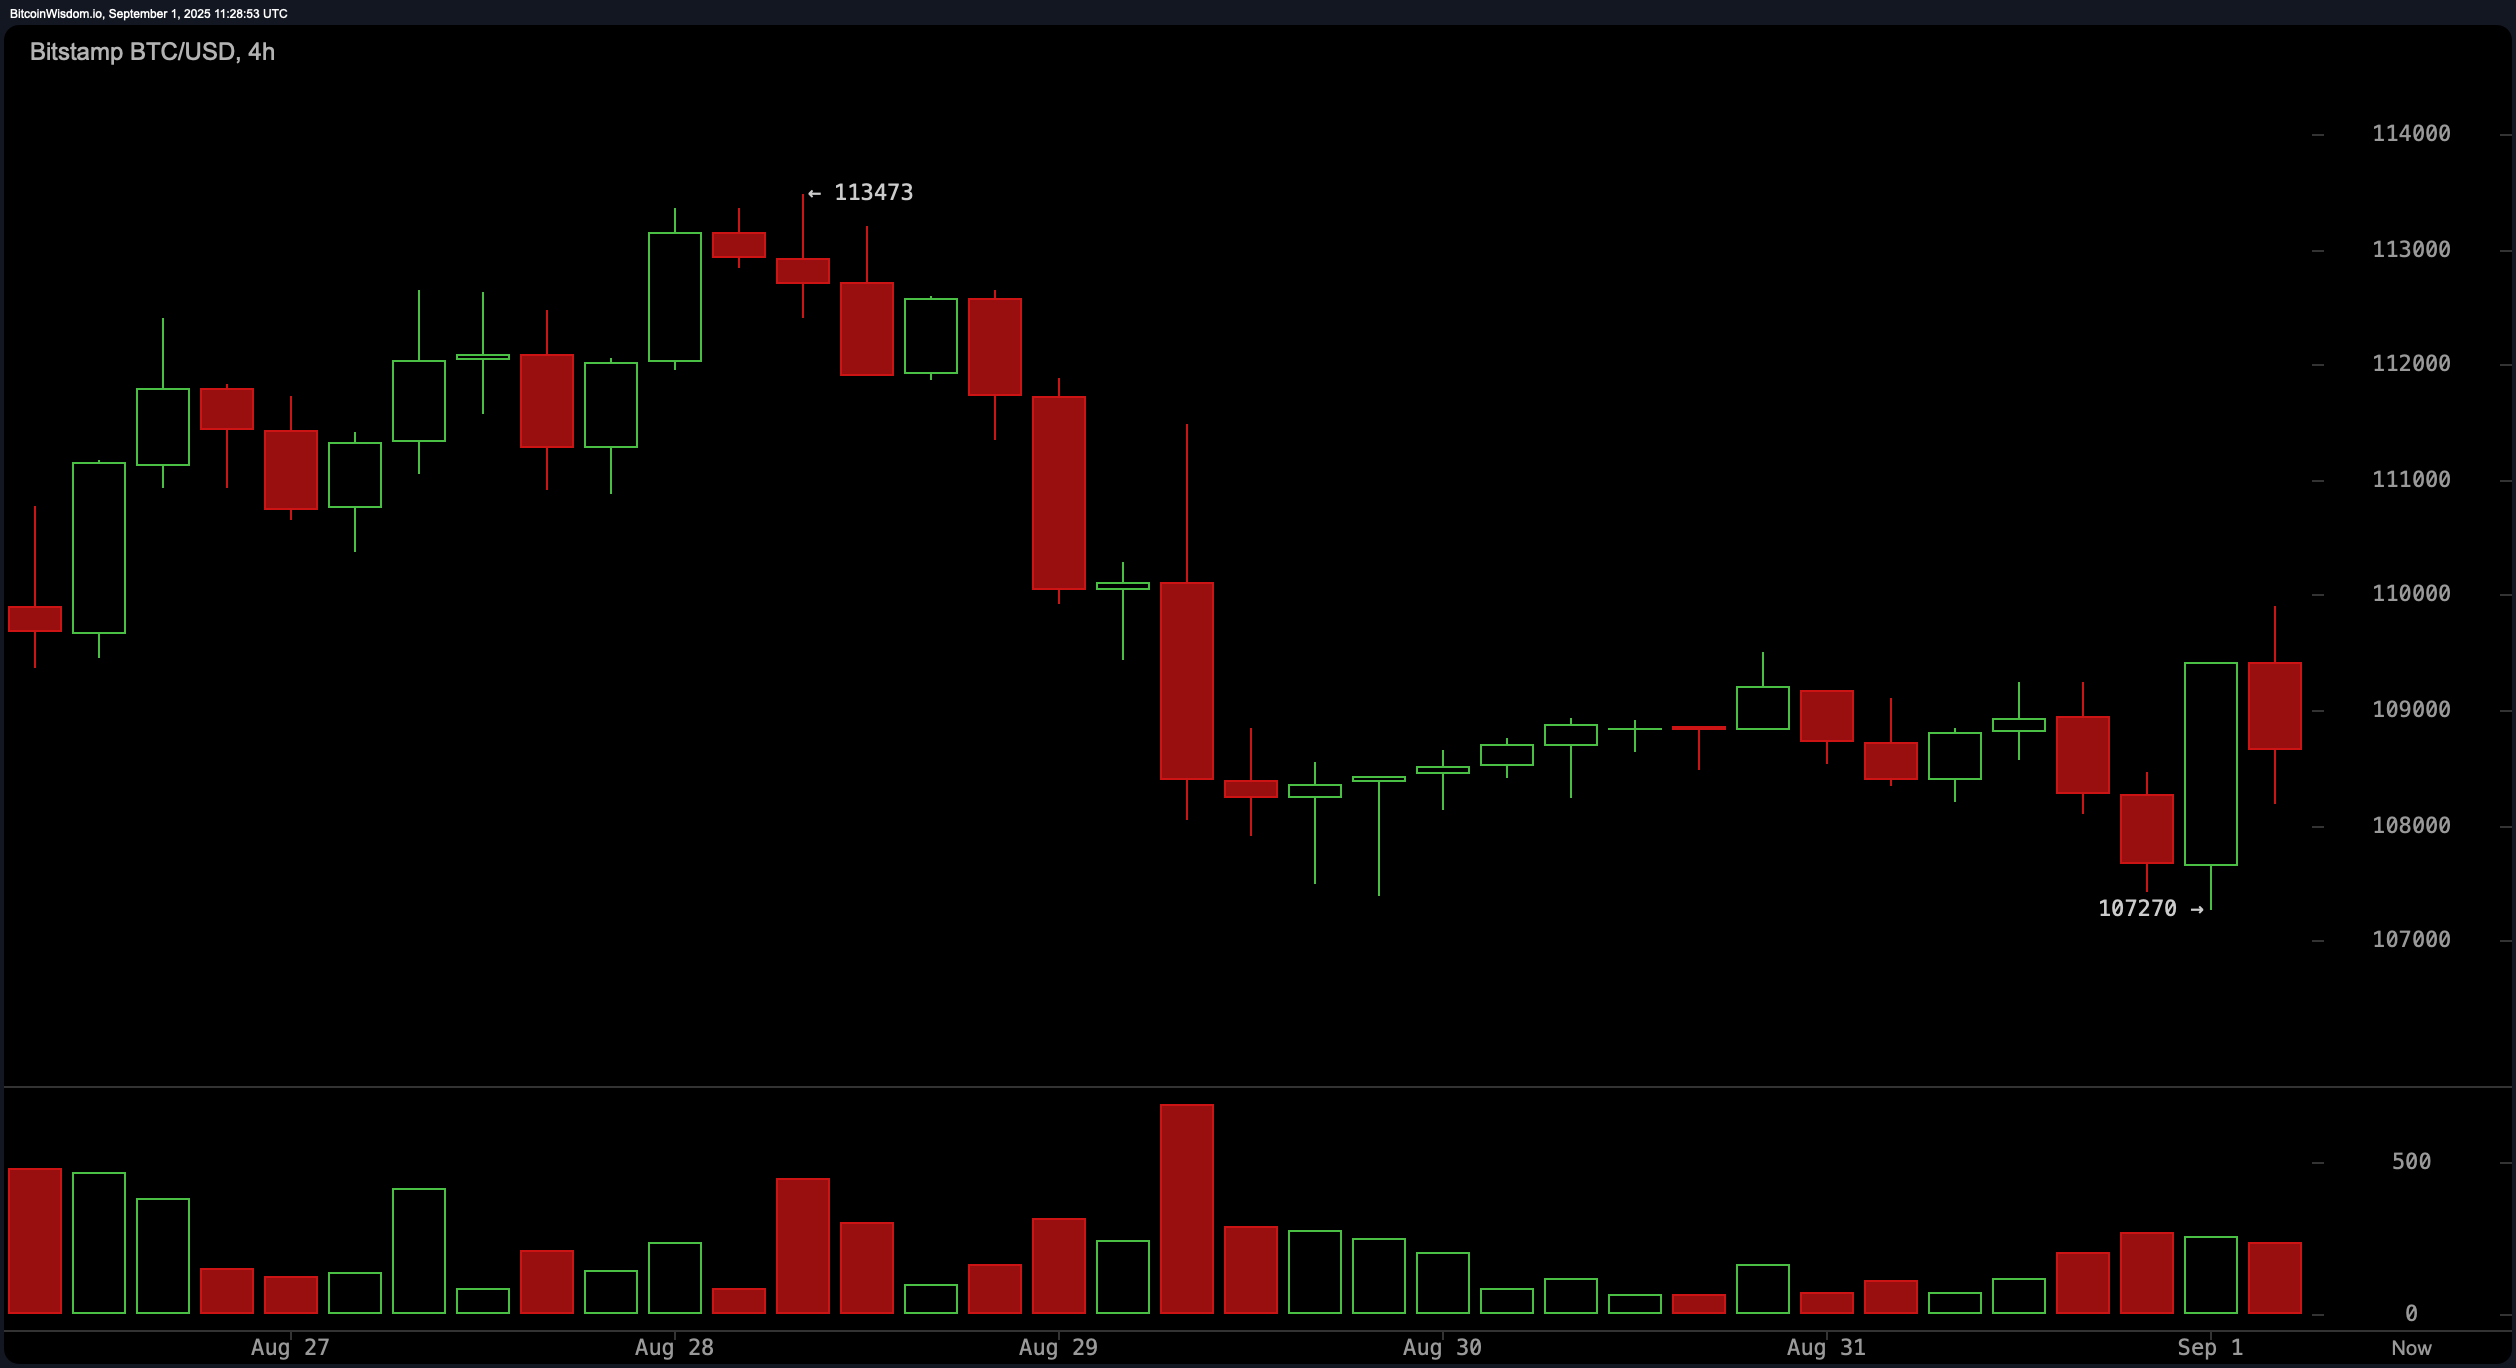
The 4-hour bitcoin chart is a tale of mid-term consolidation within a broader downtrend. It recently bounced from $107,270 up to nearly $109,000 before taking a step back. The slight uptick in volume on the green candles hints at a flicker of buyer interest, but it’s not exactly a roaring fire yet. If the price can hold above $109,000 with some strong volume, it might just spark some trades aiming for the $111,000 to $113,000 range. However, failing to maintain this level could mean the bulls are just spinning their wheels, and attention will turn back to that $107,270 support. 🚀
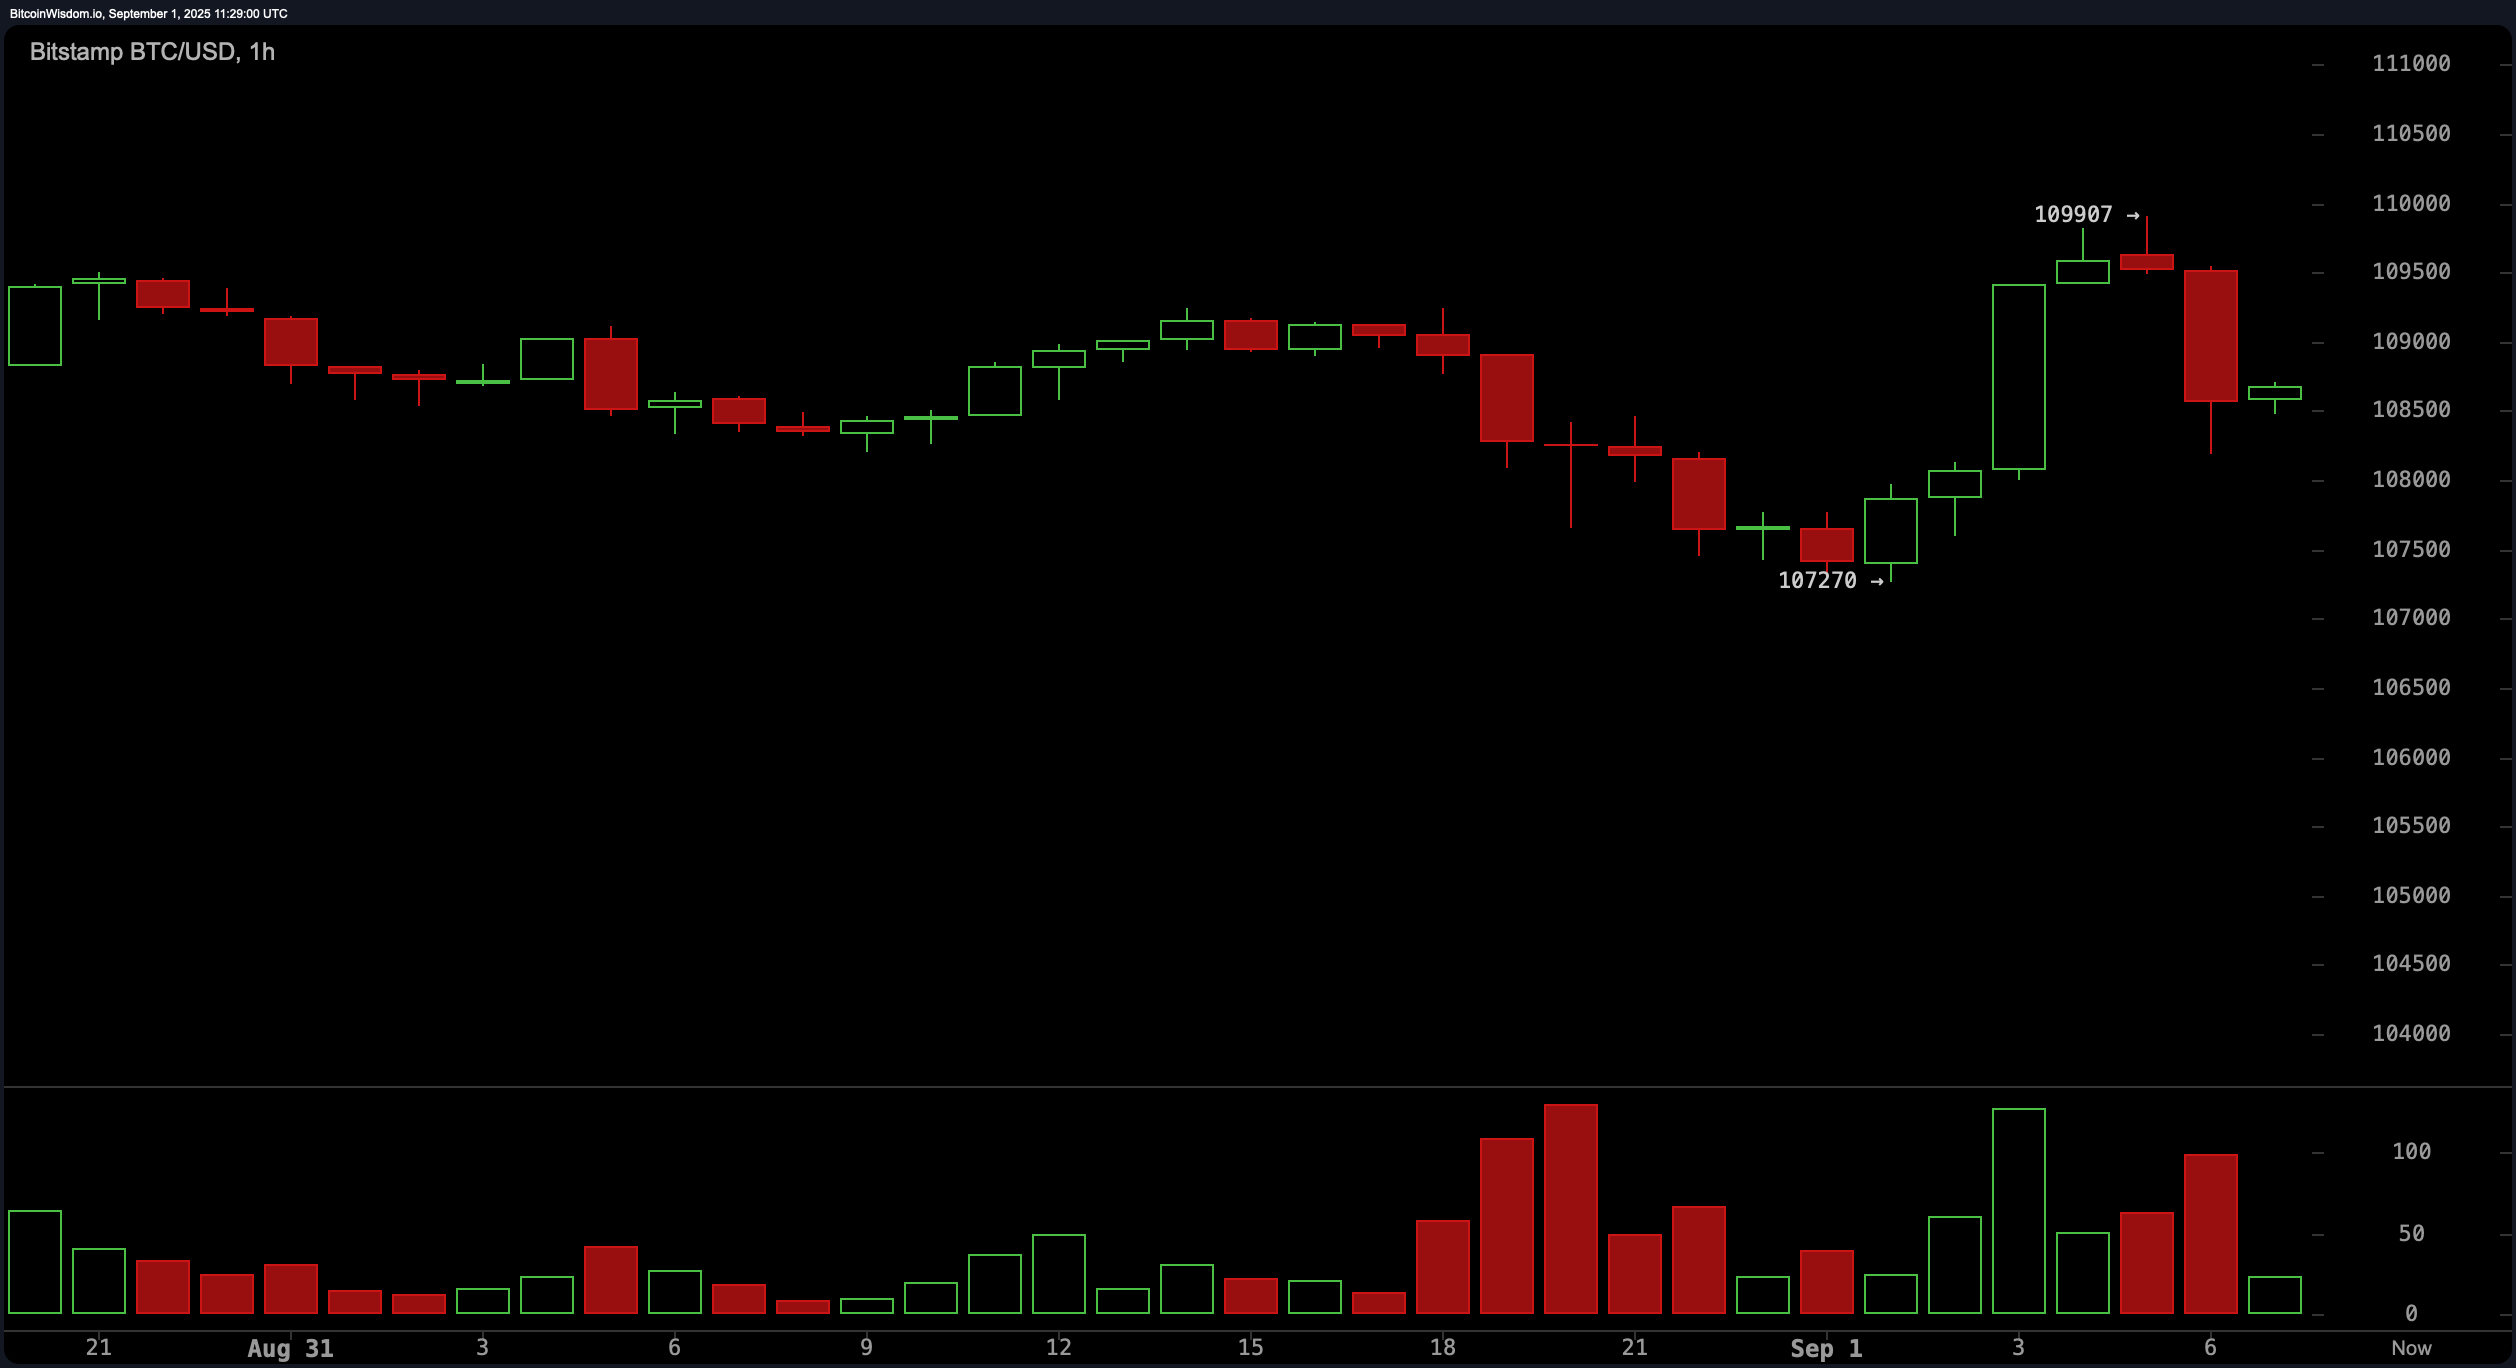
The 1-hour bitcoin chart offers a glimmer of hope, though it’s a fragile one. A mini uptrend from $107,270 to $109,900 was followed by a pullback, and now the chart seems to be forming a higher low. If the price can hold above $108,500, it might just hint at some bullish intentions. Breaking and retesting the $109,000-$109,500 range could provide some short-term trading opportunities, aiming for $110,500 to $111,000. But beware, intraday volatility is high, and a close below $107,270 would dash these hopes. 🌊
Oscillator readings are a bit of a mixed bag, much like a bag of assorted chocolates. The RSI is at 39, suggesting neutral momentum. The Stochastic oscillator and ADX also lean neutral, while the CCI hints at a potential bullish sign. On the flip side, momentum and the MACD levels are decidedly bearish, reflecting negative price acceleration and a lack of trend conviction. 📈📉
Moving average data isn’t exactly singing a bullish tune in the short to mid-term. All the major short-term indicators-EMAs and SMAs for 10, 20, 30, 50, and 100 periods-are above the current price, signaling negative vibes. Only the 200-period EMA and SMA, at $104,116 and $101,324 respectively, are showing any bullish signals. This suggests that while long-term support is still there, the short-term pressure is real. 💪🚫
If bitcoin can hold support above $108,500 and reclaim the $109,000-$110,000 range with some volume, a short-term rebound toward $112,000-$114,000 is still on the cards. A break above $114,000 would be a game-changer, potentially signaling a broader bullish reversal. 🚀
Bear Verdict:
With momentum indicators flashing sell signals and moving averages stacked against the price, bitcoin is still vulnerable to further downside. A decisive close below $107,000 would invalidate the bullish setups and could lead to a retracement toward $104,000 or even lower. 🦁
Read More
- Brent Oil Forecast
- Gold Rate Forecast
- Silver Rate Forecast
- SUI PREDICTION. SUI cryptocurrency
- STRK Skyrockets: Bitcoin Staking Turns Starknet into a Circus of Gains! 🎢💰
- Why Morgan Stanley Bets Bullish on Stocks Amid Iran Tensions
- 🚀 Solana’s November: Bull Run or Bull Plop? 🌽
- XRP’s Big ‘Bottom’ Might Just Be a Pile O’ Trouble 🐀💣
- Ripple CEO Brad Garlinghouse Says THIS as Trump Calls Out Banks Over Crypto Bill
- ONDO PREDICTION. ONDO cryptocurrency
2025-09-01 15:59