As of 8 a.m. Saturday, Bitcoin is trading for between $67,974 and $68,138. Its total market value is $1.35 trillion, with $46.99 billion worth of Bitcoin traded in the last 24 hours. The price has fluctuated between $66,585 and $68,236 today. Currently, Bitcoin is hovering just below a key price level, and experts believe a significant price move is likely to happen soon.
Bitcoin Chart Outlook
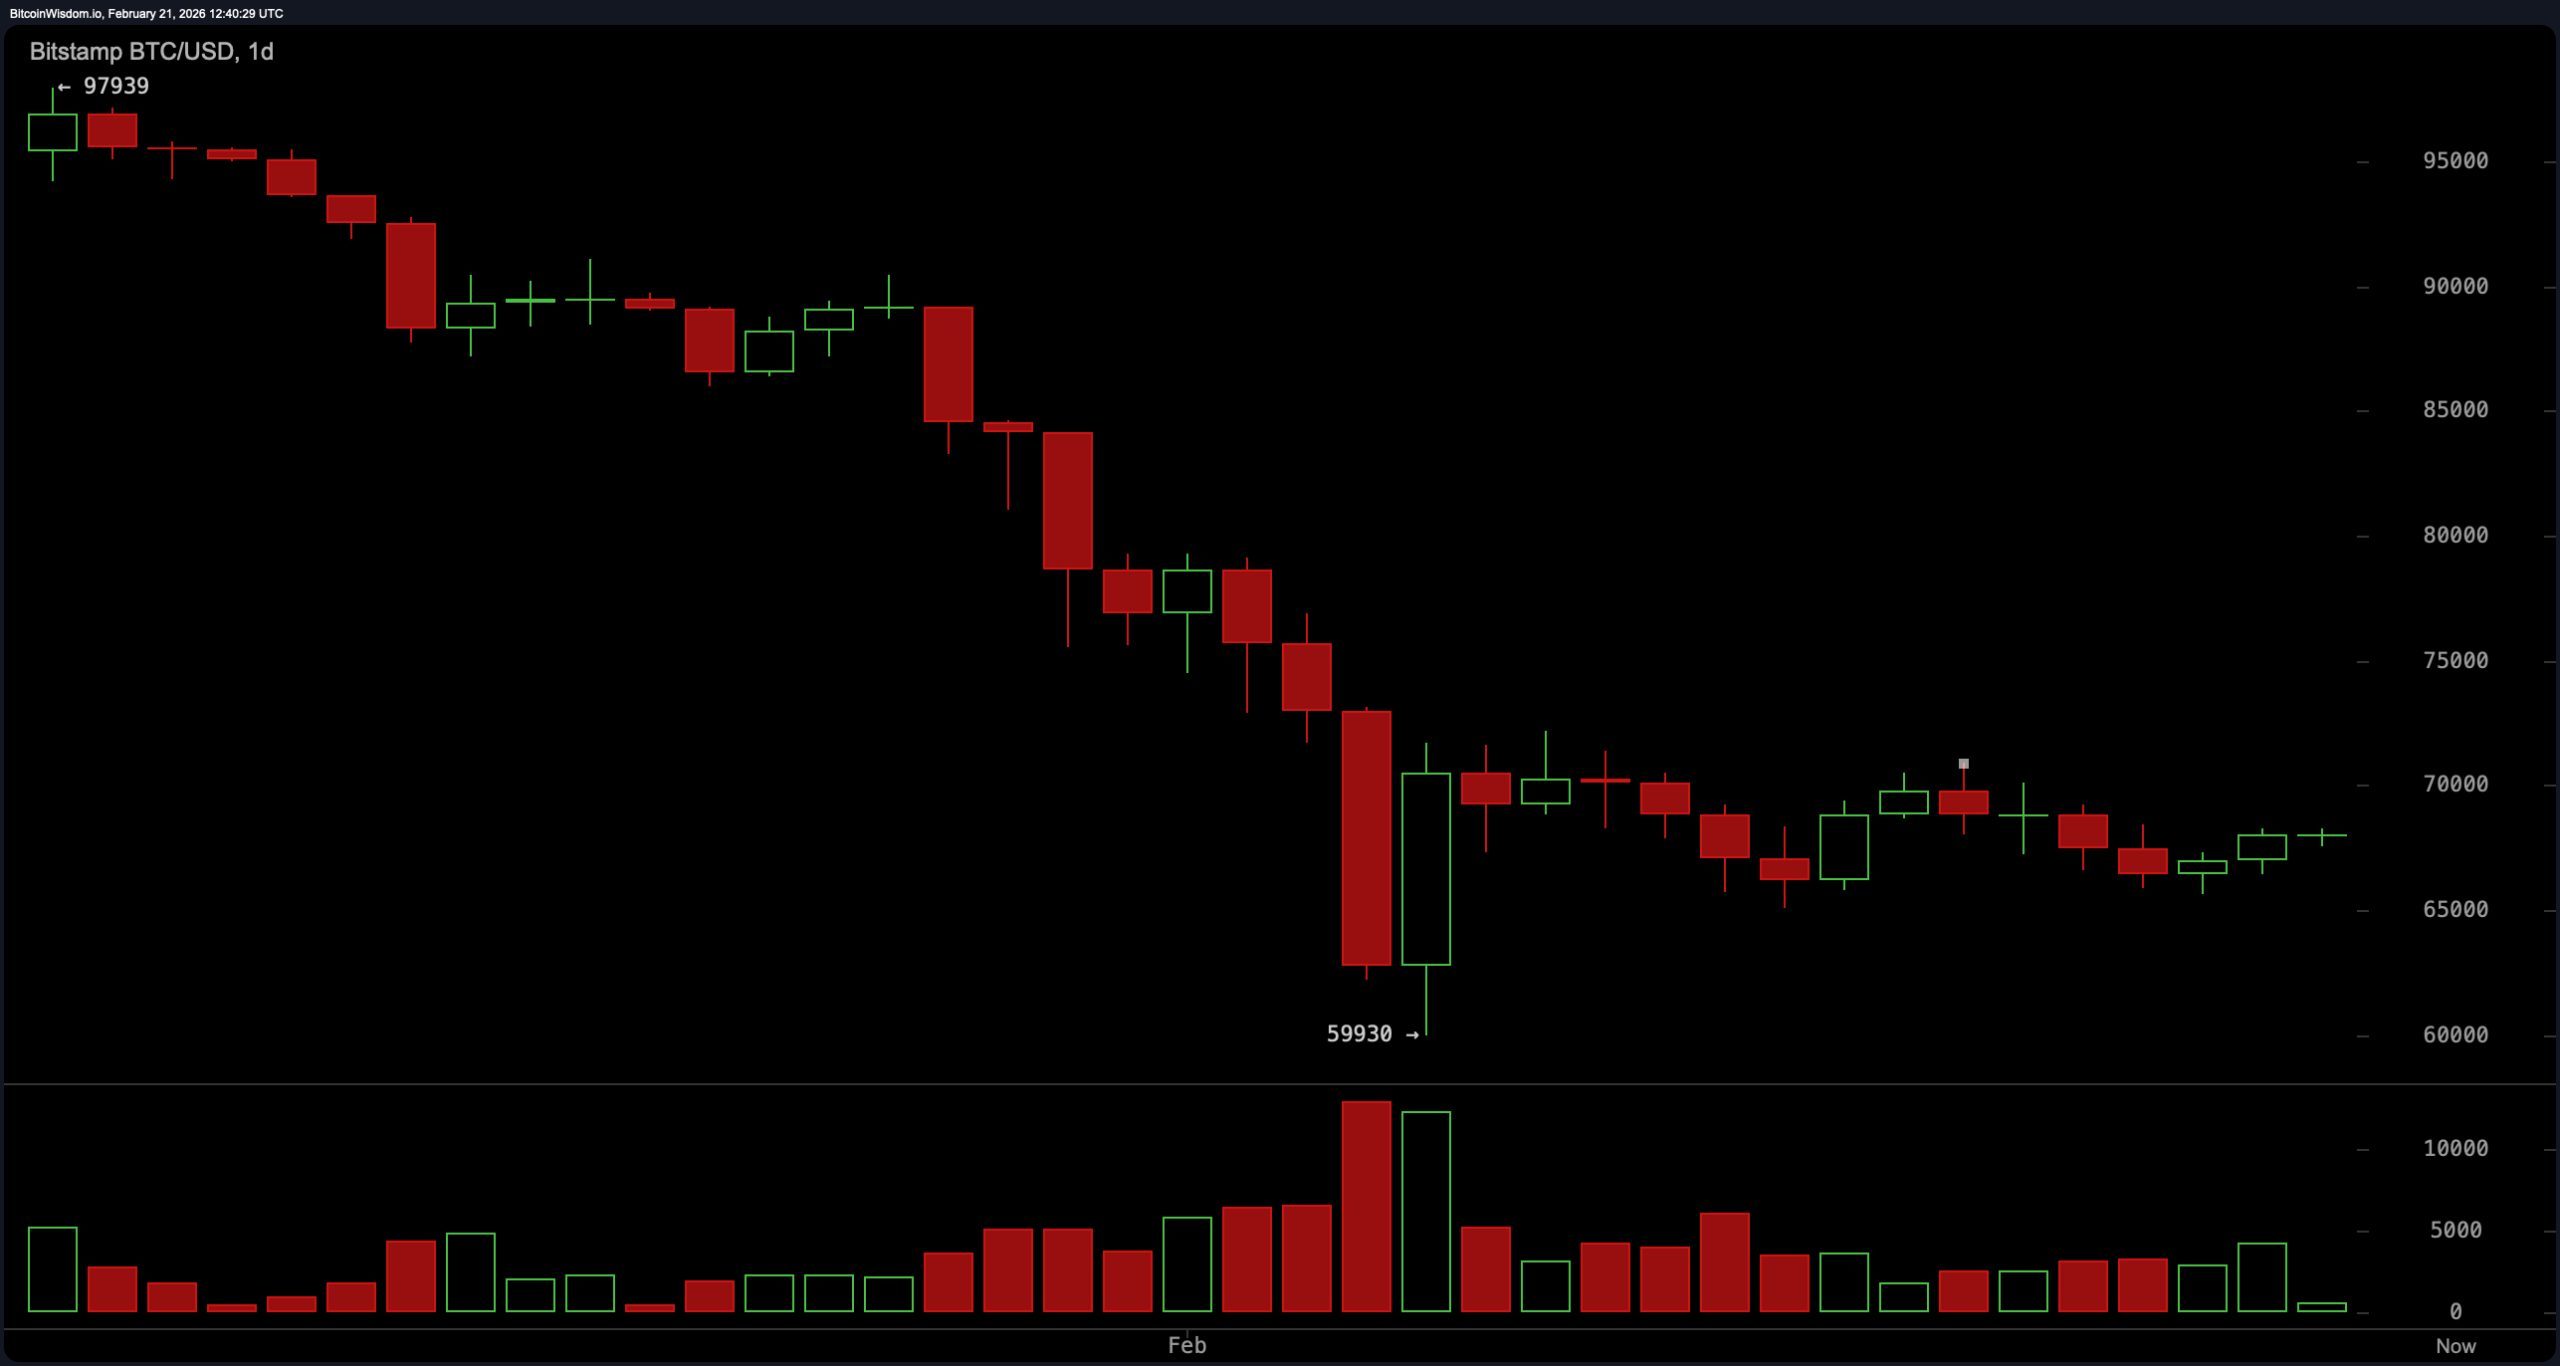
On the daily timeframe, bitcoin remains in a corrective phase that began after the decline from roughly $97,900 to the $59,930 low. The rebound into the high-$60,000s has stabilized price action, but the structure remains capped beneath $70,000 to $71,500, a clearly defined supply zone.
Major support sits at $59,900 to $60,000, with secondary support between $65,000 and $66,000. Until there is a firm daily close above $71,000 accompanied by expanding volume, this price action reflects a relief rally within a broader corrective structure rather than a confirmed macro reversal.
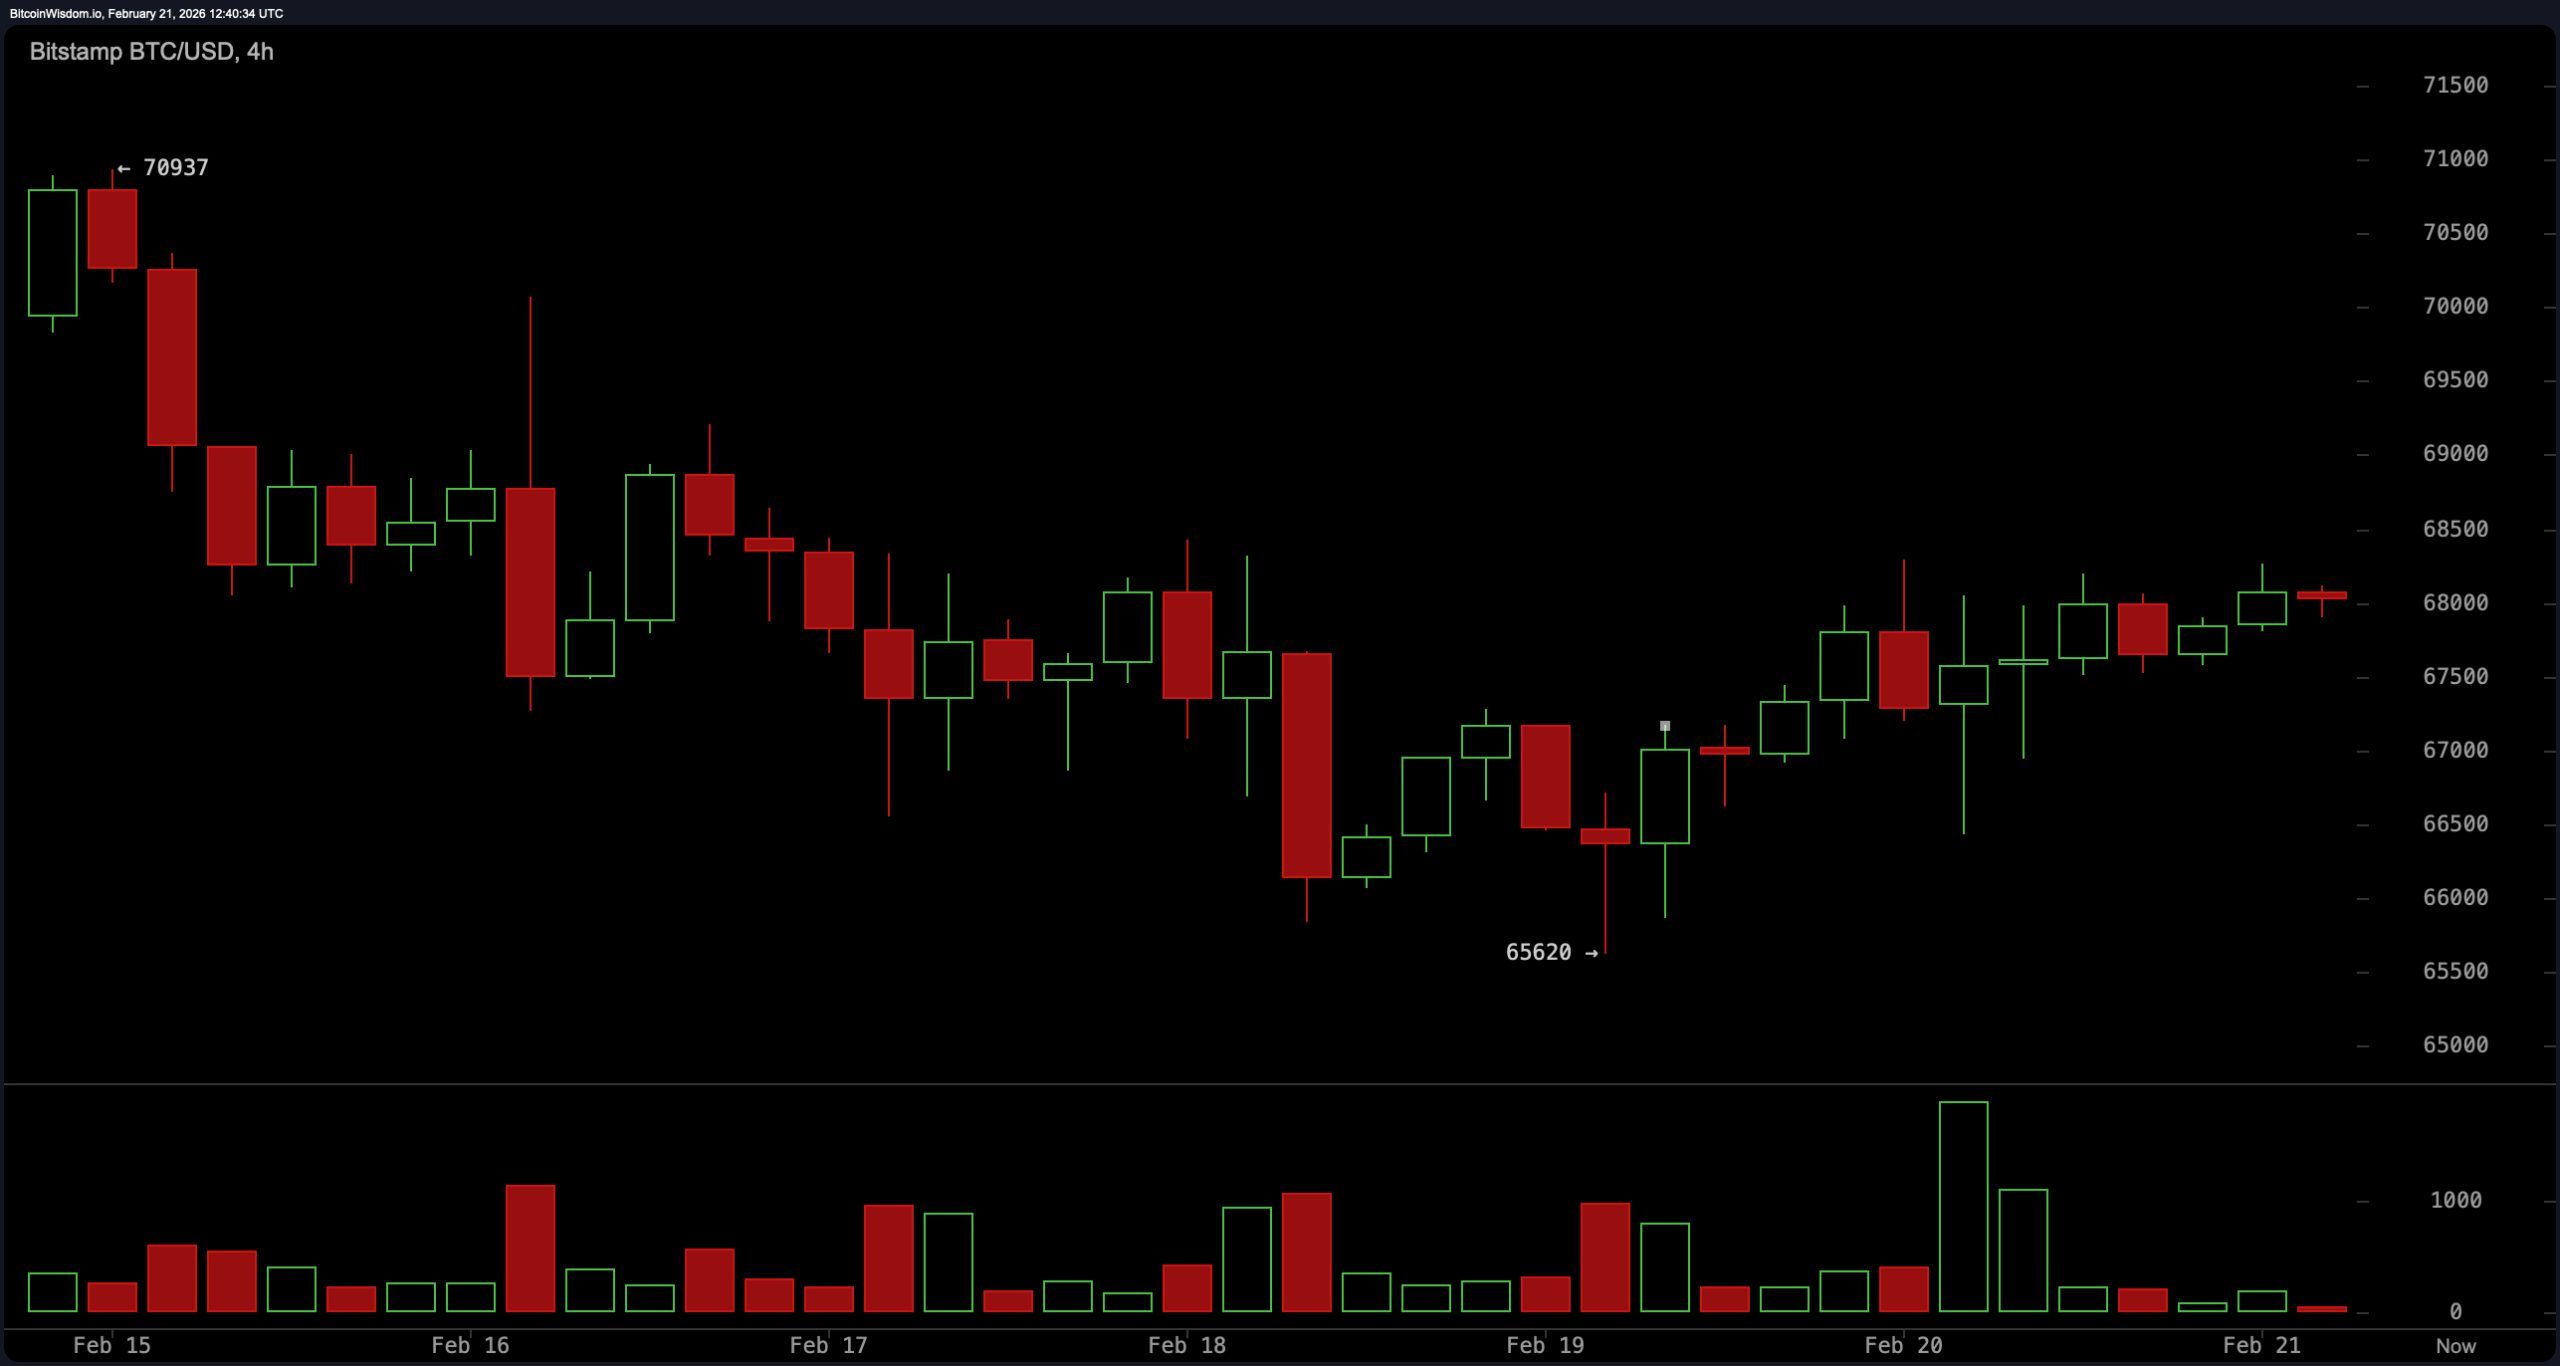
Looking at the four-hour price chart, the price has been slowly but steadily making higher lows, starting around $65,620. This suggests a short-term upward trend. Currently, the price is finding support between $66,000 and $66,500, and facing resistance between $68,800 and $69,200. It’s repeatedly tried to break through $69,000 but keeps falling back, creating a squeezed, tight trading range. Historically, these tight ranges usually lead to a significant price move. If the price can break above $70,000, it’s likely to continue higher. However, if it can’t hold above $67,500, it could fall back down to the $66,000-$66,500 support level. Essentially, the market is building pressure, and these situations don’t usually last for long.
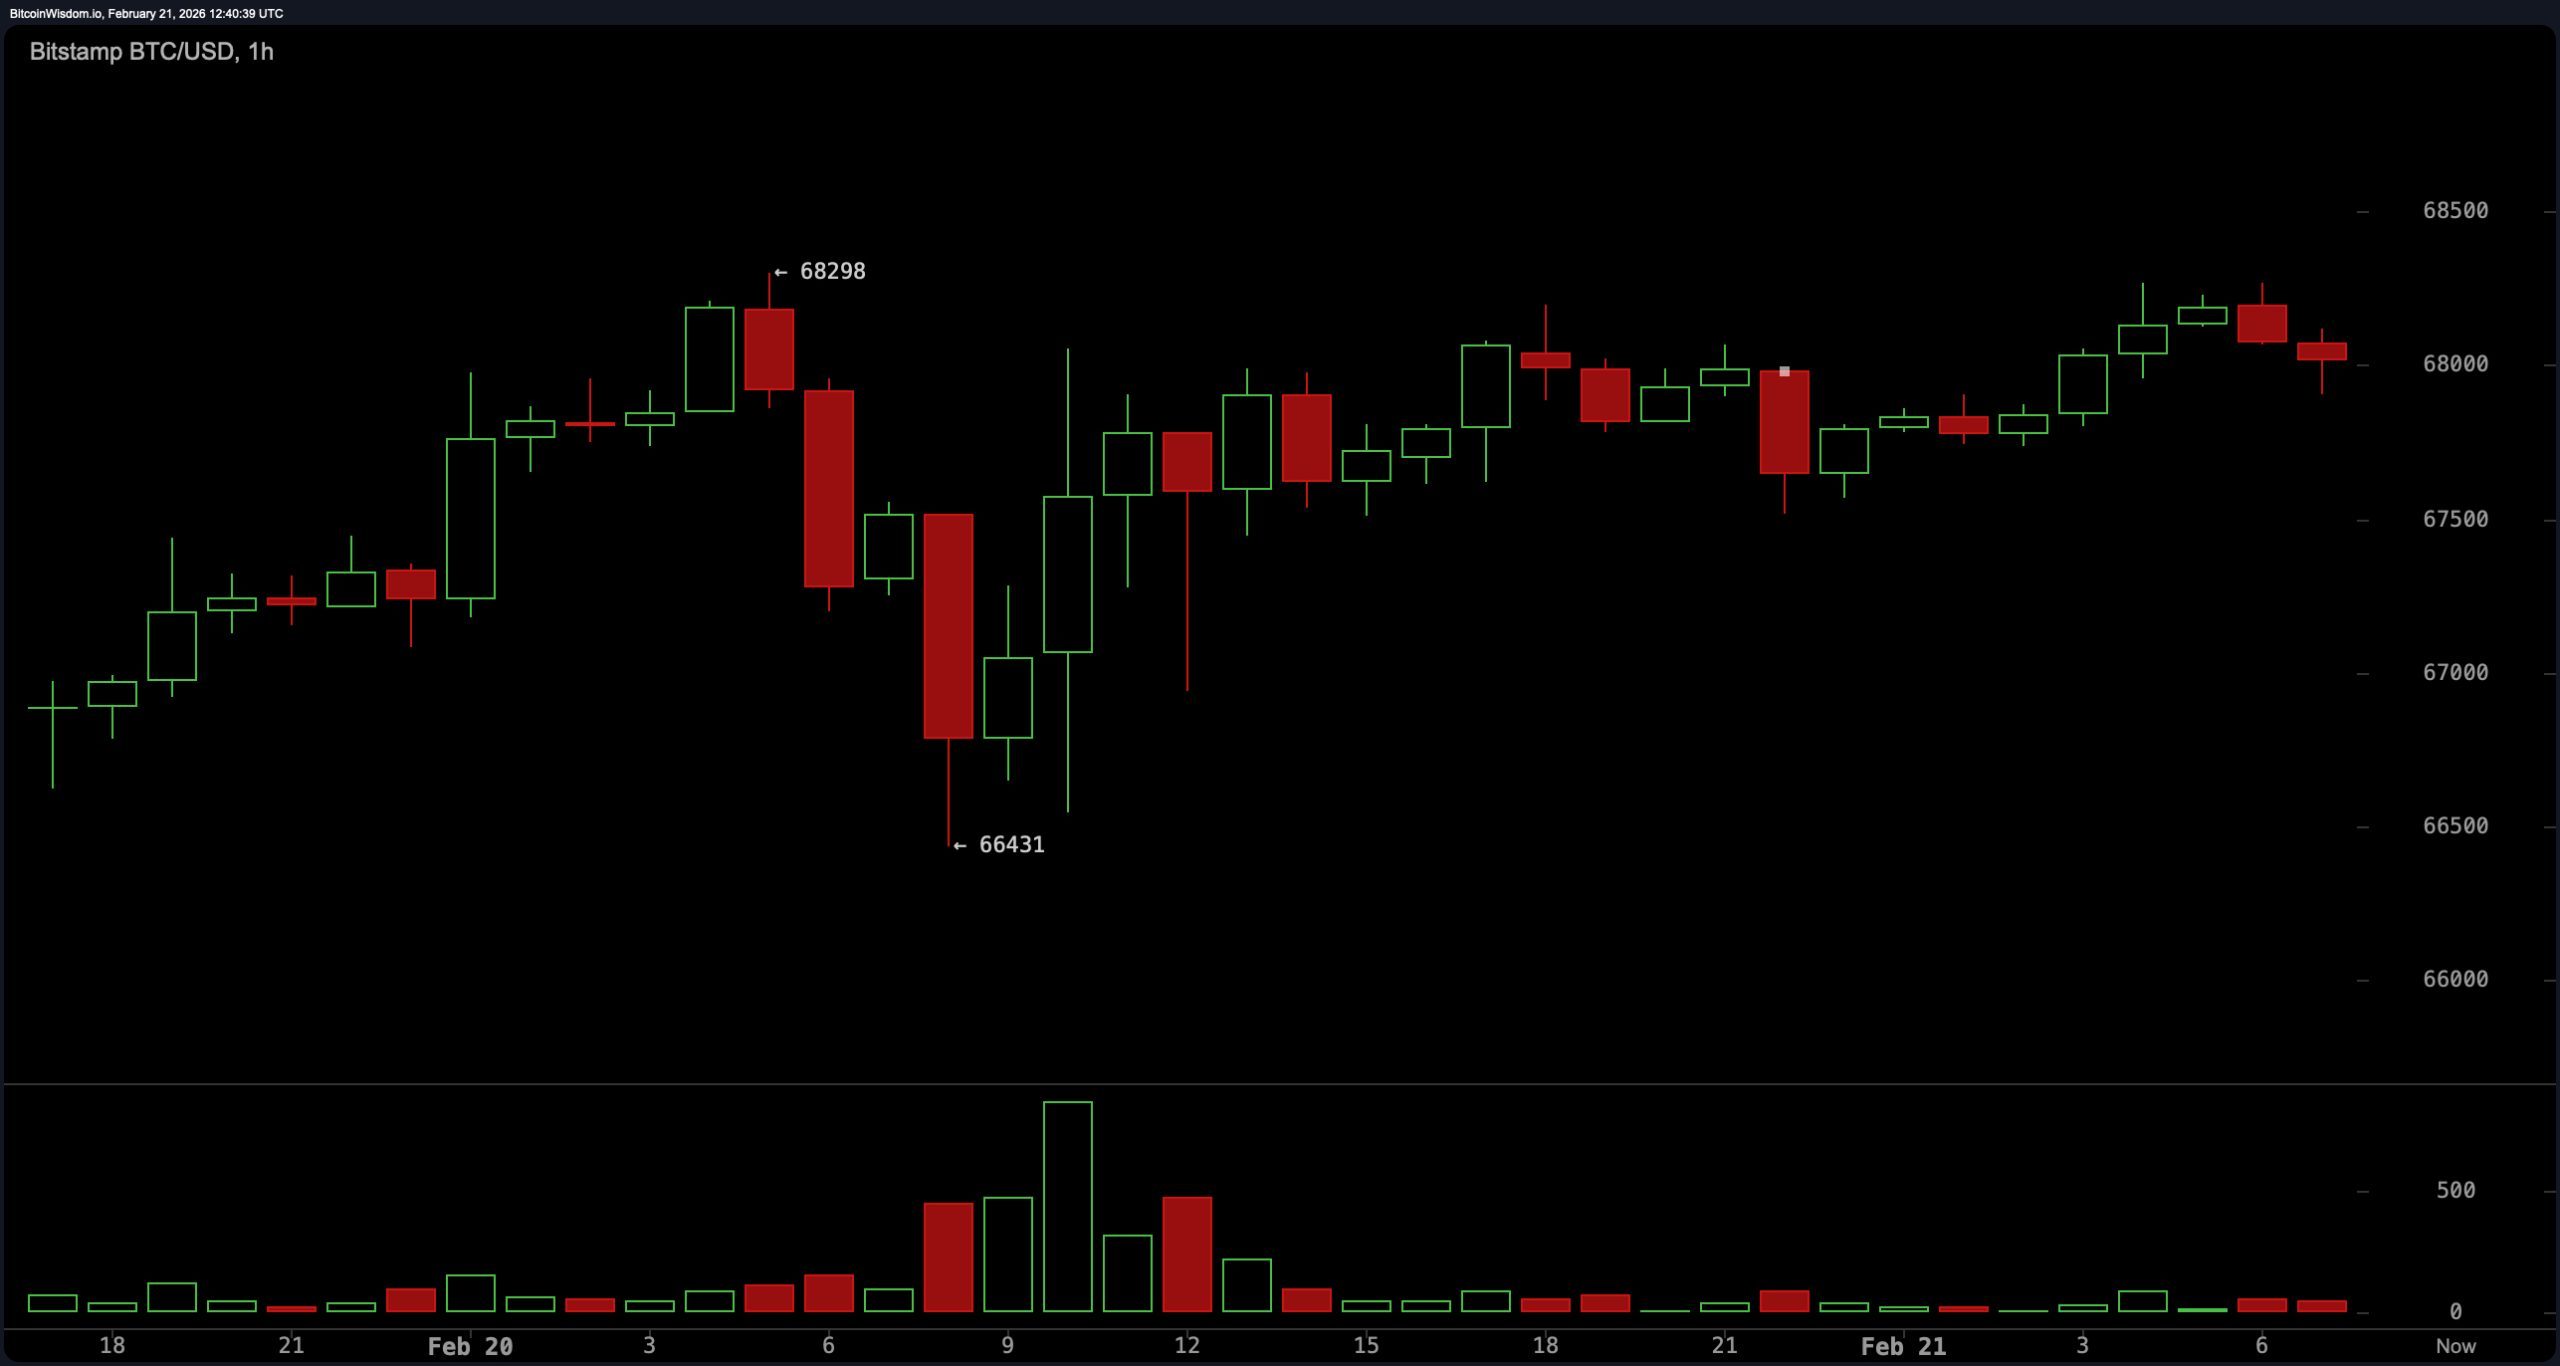
On the one-hour timeframe, bitcoin is locked in tight consolidation between $67,500 and $68,800. Immediate support is $67,600, with a local pivot at $68,000 and resistance between $68,800 and $69,000. Volume is fading, candles are smaller, and volatility has contracted — classic pre-expansion behavior. A break of this micro-range is projected to generate a $1,000 to $1,500 impulse move. In other words, this is the calm before the storm, not a sign that traders have collectively decided to take a nap.
Momentum indicators reflect a neutral-to-constructive short-term posture. The relative strength index ( RSI) reads 37, the Stochastic oscillator stands at 47, and the commodity channel index (CCI) registers negative 42 — all categorized as neutral. The average directional index (ADX) at 58 signals trend strength, though not directional bias.
The Awesome oscillator prints negative 9,297, also neutral. Notably, momentum at 991 and the moving average convergence divergence ( MACD) level at negative 4,012 are positioned positively according to the data. This divergence between price compression and stabilizing momentum adds weight to the probability of an imminent volatility expansion.
The moving average (MA) structure points to the broader corrective backdrop. The exponential moving average (EMA) (10) at $68,289 signals downside pressure, while the simple moving average (SMA) (10) at $67,926 offers slight short-term support. However, the EMA (20) at $70,946, SMA (20) at $69,268, EMA (30) at $73,813, and SMA (30) at $74,708 all reflect firm overhead resistance.
Several key moving averages – the 50-day EMA at $78,242, SMA at $81,761, 100-day EMA at $85,528, SMA at $85,565, 200-day EMA at $92,565, and SMA at $99,166 – suggest a continuing downward trend. The overall technical outlook remains negative until the price consistently rises above the $69,000 to $71,000 range. While short-term price action looks promising, this broader trend needs to be overcome for a more positive outlook.
Bull Verdict:
If bitcoin reclaims and closes decisively above the $69,000 to $71,000 resistance corridor, particularly with expanding volume on the daily timeframe, the structure shifts meaningfully in favor of upside continuation. A sustained move above $71,000 would invalidate the broader corrective narrative and expose $74,000 to $75,000 as the next higher-timeframe resistance band. With the relative strength index ( RSI) stabilizing, the moving average convergence divergence ( MACD) showing constructive positioning, and short-term higher lows developing on the four-hour chart, bullish momentum would likely accelerate quickly. In that scenario, compression resolves upward — and when bitcoin expands, it rarely does so quietly.
Bear Verdict:
If the price can’t break above $69,000-$71,000 and then falls below $66,000, it’s likely we’ll see a larger drop, potentially down to $60,000. This would confirm a continuing downward trend, with several key moving averages acting as strong resistance levels. A move below $66,000 would also erase the recent short-term upward pattern and refocus attention on the previous low near $59,900. Instead of gearing up for a price increase, the market would likely be setting up for another significant decline.
FAQ ❓
- What is the bitcoin price on Feb. 21, 2026?
Bitcoin is trading at $67,974 with a 24-hour range between $66,585 and $68,236. - What are the key bitcoin resistance levels right now?
The primary resistance zone for bitcoin sits between $69,000 and $71,500 on higher timeframes. - Where is bitcoin’s strongest support level?
Major support is located at $59,900 to $60,000, with secondary support near $65,000 to $66,000. - Is bitcoin in a bullish or bearish trend?
Short-term structure is constructive, but the daily chart remains in a broader corrective phase below $71,000.
Read More
- Gold Rate Forecast
- Silver Rate Forecast
- Brent Oil Forecast
- Bitcoin’s Big Sigh: ETFs Flee as Miners Outpace Demand! 🐢💸
- 🇯🇵 Yen Stablecoins: Japan’s New Digital Samurai Sword? 🗡️💰
- Dogecoin’s Descent: Will It Hit $0.13? 🐕💸
- DOGE PREDICTION. DOGE cryptocurrency
- Bitcoin Flees, Ethereum and Friends Throw a Wild Party 🎉💸
- Dogecoin’s 45% Crash: Whale Sell-Offs & Meme Coin Mayhem 🐕💸
- Japan’s Yen Stablecoin: Genius or Financial Disaster? 🤔
2026-02-21 17:37