Bitcoin is currently staying above the $70,000 mark, which seems positive. However, a closer look at where this support is coming from suggests a more careful outlook is warranted.
A recent report analyzing Bitcoin prices shows a slight difference between exchanges: Binance is currently pricing Bitcoin at $70,747, while Coinbase lists it at $70,533 – a $213.95 difference. While seemingly small, this gap suggests that Binance is currently seeing more buying activity than Coinbase.
The difference in price between Coinbase and Binance is a long-standing indicator of how much demand there is for cryptocurrencies. If Coinbase prices are higher, it shows strong buying interest from investors in the US. Currently, Coinbase is trading at a lower price, which means buying activity is happening more actively in global markets and US demand is weakening. This suggests the strong US buying that previously drove Bitcoin’s price increases is currently subdued.
Saying the price is $70,000 isn’t necessarily false, but it’s currently unconfirmed. The price itself is genuine, however, the market that usually drives these values hasn’t yet demonstrated it agrees with that price.
The Bitcoin Spread That Separates a Rally From a Trend
The report highlights a pattern from past Bitcoin bull markets. Historically, when US buyers paid more for Bitcoin than international buyers (a positive Coinbase-Binance spread), significant and lasting price increases followed. This happens because large US institutional investors are confident and, when they buy, not only drive the price up, but also establish a strong base for continued growth.

Currently, the situation is reversed. The gap, at -$213.95, is small but remains consistently negative, and that’s what the report highlights as a worry. A quick dip into negative territory can often be explained by temporary factors or trading strategies. However, a negative spread that continues while the price stays above $70,000 suggests something more significant – US investors are being cautious, potentially selling to realize profits, and the market is relying on international activity to maintain the price level, as domestic demand isn’t currently strong enough to do so.
The report presents a simple either/or scenario. If the current trend continues negatively, prices will likely fall—not because people are selling, but because there isn’t enough buying activity. However, if the trend reverses and turns positive, it will signal a return of investment into the US market, renewed confidence from institutions, and could establish $70,000 as a strong support level for prices.
The market is in anticipation. The spread will break that silence first.
Bitcoin Consolidates Above $70K as Recovery Lacks Conviction
Bitcoin is currently trading at $71,351, staying above the important $70,000 level. This comes after a significant drop in price with heavy trading activity last month. While the price has stabilized, the chart suggests underlying weakness hasn’t been fully resolved, meaning it’s found support but hasn’t yet established a clear trend.
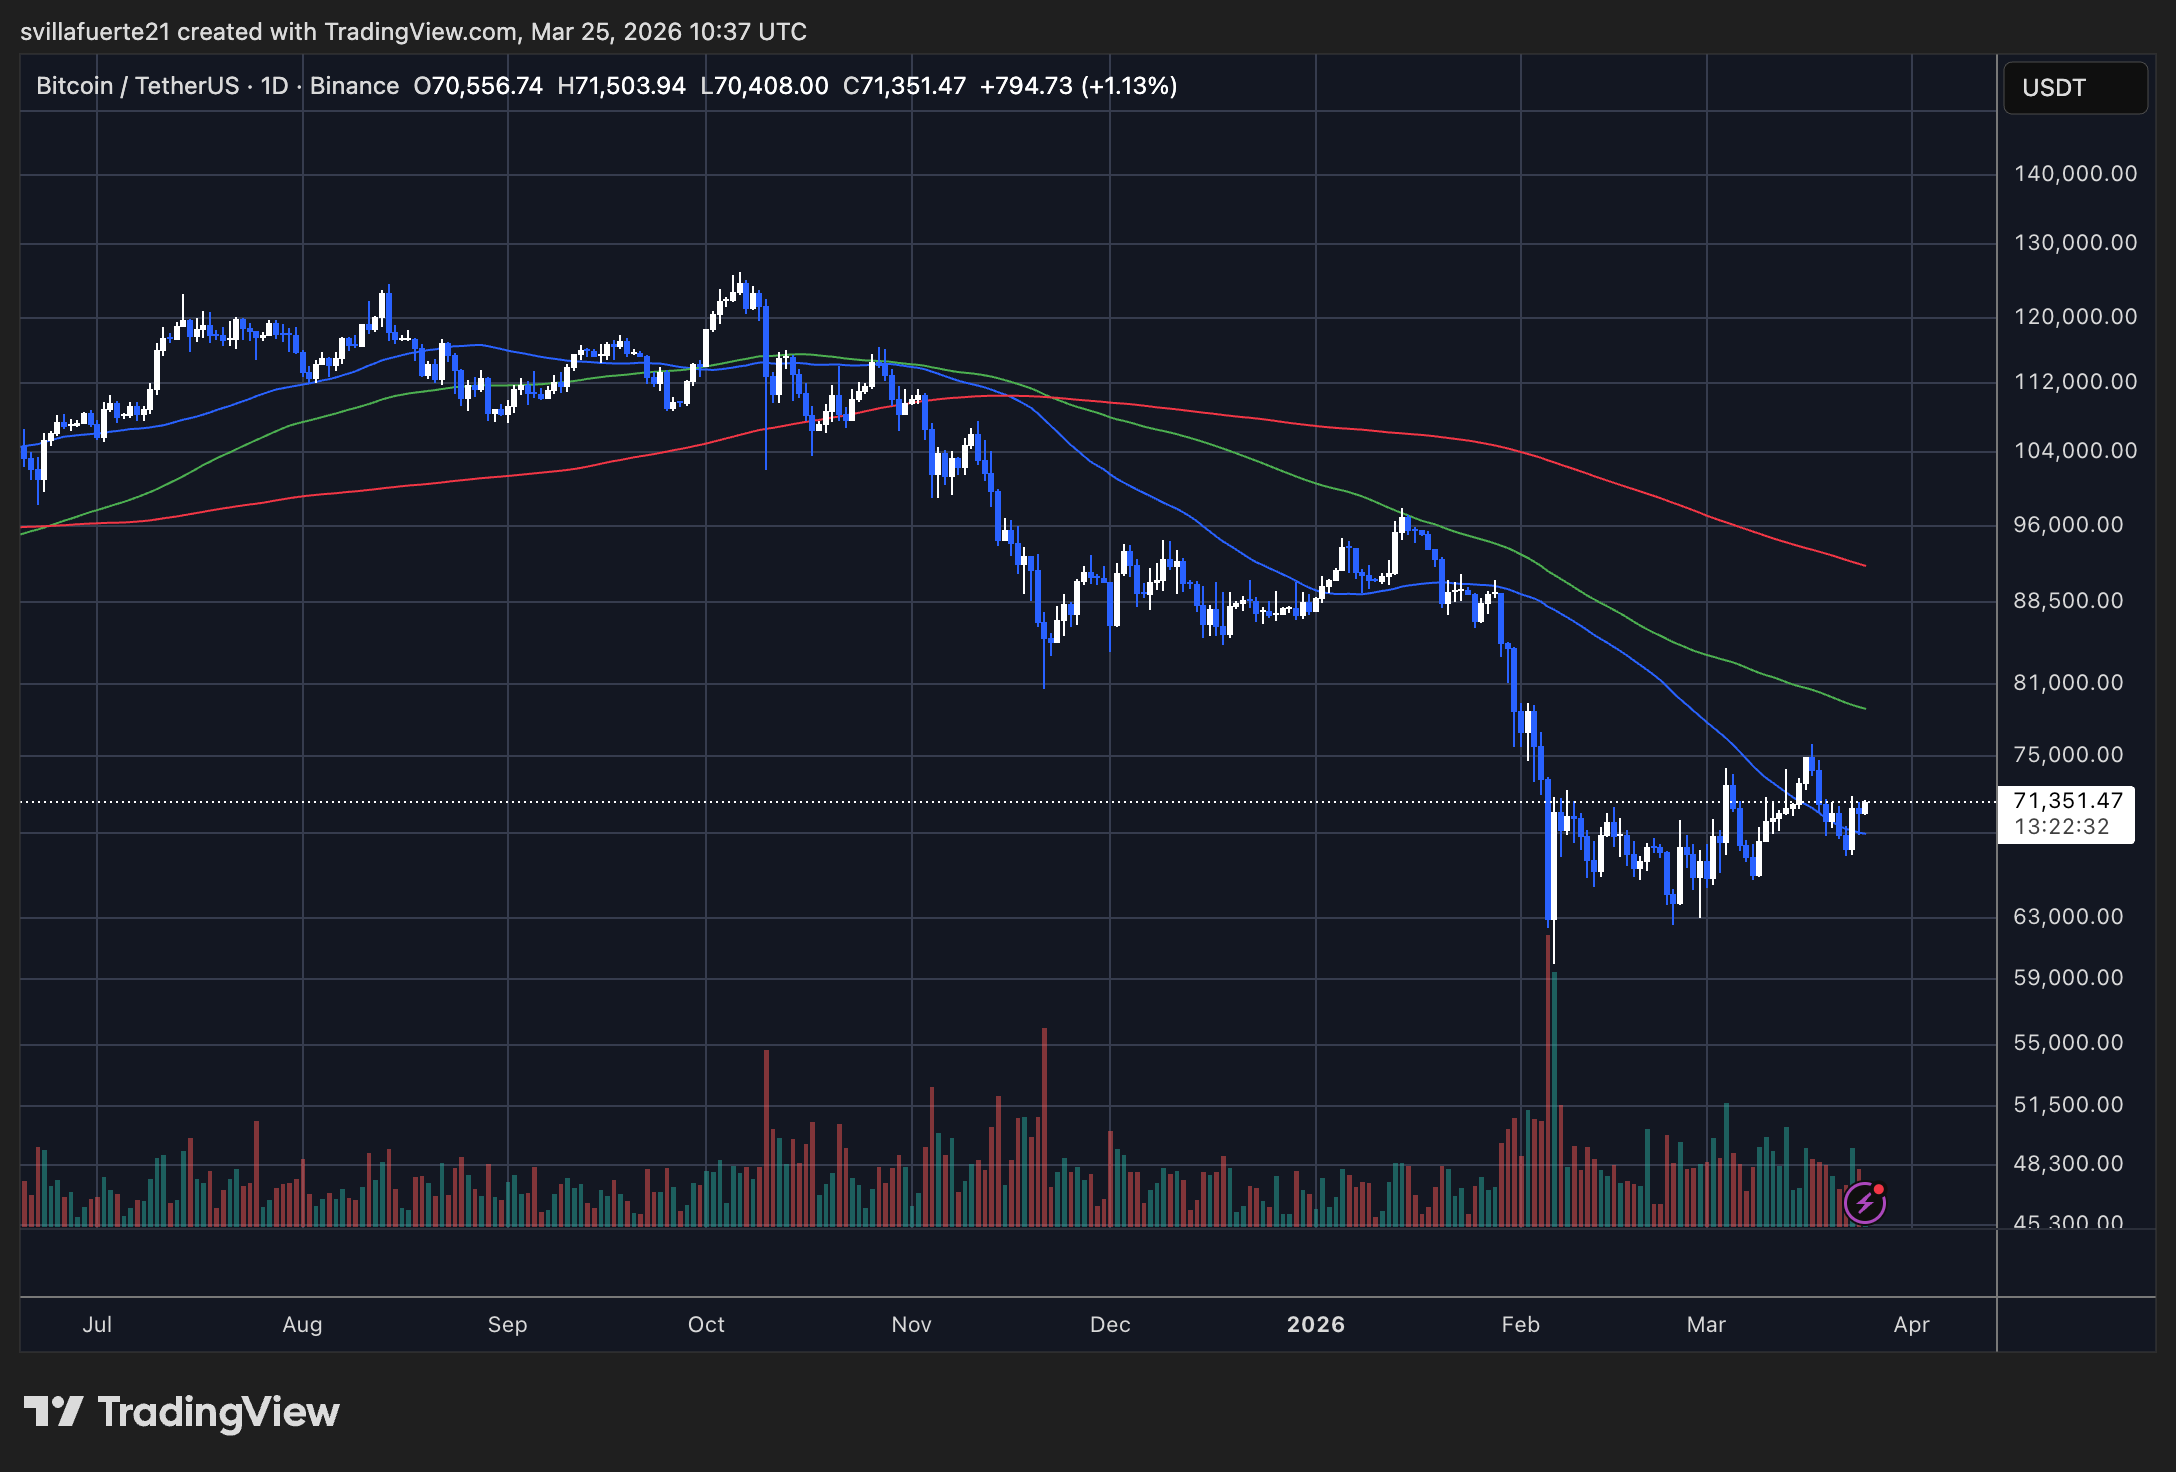
The overall trend is clear: the price is still below both the 50-day and 100-day moving averages, and these averages are continuing to fall. This confirms that the downward momentum hasn’t stopped. The 200-day moving average is also falling, currently around $96,000, which is far above the current price. Instead of acting as a near-term price ceiling, it mainly highlights how much the price has dropped since its high above $125,000 in October.
As a researcher, I’ve been tracking the market closely, and the recent attempt to break through the $74,000-$75,000 level failed. This isn’t just a minor setback; it indicates that the 50-day moving average is a significant resistance point. More importantly, it suggests that the current price increase is likely a temporary bounce – a corrective move – rather than the start of a new, sustained upward trend. Essentially, we’re seeing a relief rally, not a true reversal of the previous downward momentum.
Trading volume supports the idea that people are doubtful about the recent price movements. We saw the most trading activity during the price drops and the sharp decline to $59,000 in February. The current recovery is happening with much less trading, suggesting a lack of strong belief and limited participation, which is hindering the upward trend.
Bitcoin is currently trading in a narrow range between $70,000 and $75,000. A strong close above $75,000 is needed for the price to potentially move higher. If the price falls below $70,000, it could quickly drop to $65,000, with little support expected in between.
Read More
- Gold Rate Forecast
- Brent Oil Forecast
- Silver Rate Forecast
- USD CNY PREDICTION
- CNY JPY PREDICTION
- PEPE PREDICTION. PEPE cryptocurrency
- Citi’s Crypto & AI Uprising: Will Your Portfolio Survive? 🚀
- BTC PREDICTION. BTC cryptocurrency
- ETH PREDICTION. ETH cryptocurrency
- SOL EUR PREDICTION. SOL cryptocurrency
2026-03-26 00:05