Bitcoin is currently trading around $74,600, showing a significant rebound in recent weeks. This positive movement is likely due to improving optimism about potential ceasefire talks between the US and Iran. While the overall downward trend hasn’t fully reversed, this recent increase is the strongest challenge Bitcoin has made to key resistance levels since the price drop in February, and the next few days will be important to watch.
Bitcoin Price Analysis: The Daily Chart
Bitcoin is once again approaching the $75,000–$80,000 price range, a level that previously stopped it from rising further. This resistance area lines up with a key moving average around $75,000 and the top of its current trading channel. This time, however, the upward momentum, as indicated by the Relative Strength Index (RSI) moving into the 60s, suggests this attempt to break through may be more successful than previous ones.
If the price consistently stays above $80,000, it would be a major breakthrough, signaling an end to the downward trend that’s been in place since October 2025. Until that happens, traders should be cautious of the resistance level, as it’s proven strong in recent months. On the downside, $60,000 remains a critical support level to watch if the price falls again after hitting resistance.
BTC/USDT 4-Hour Chart
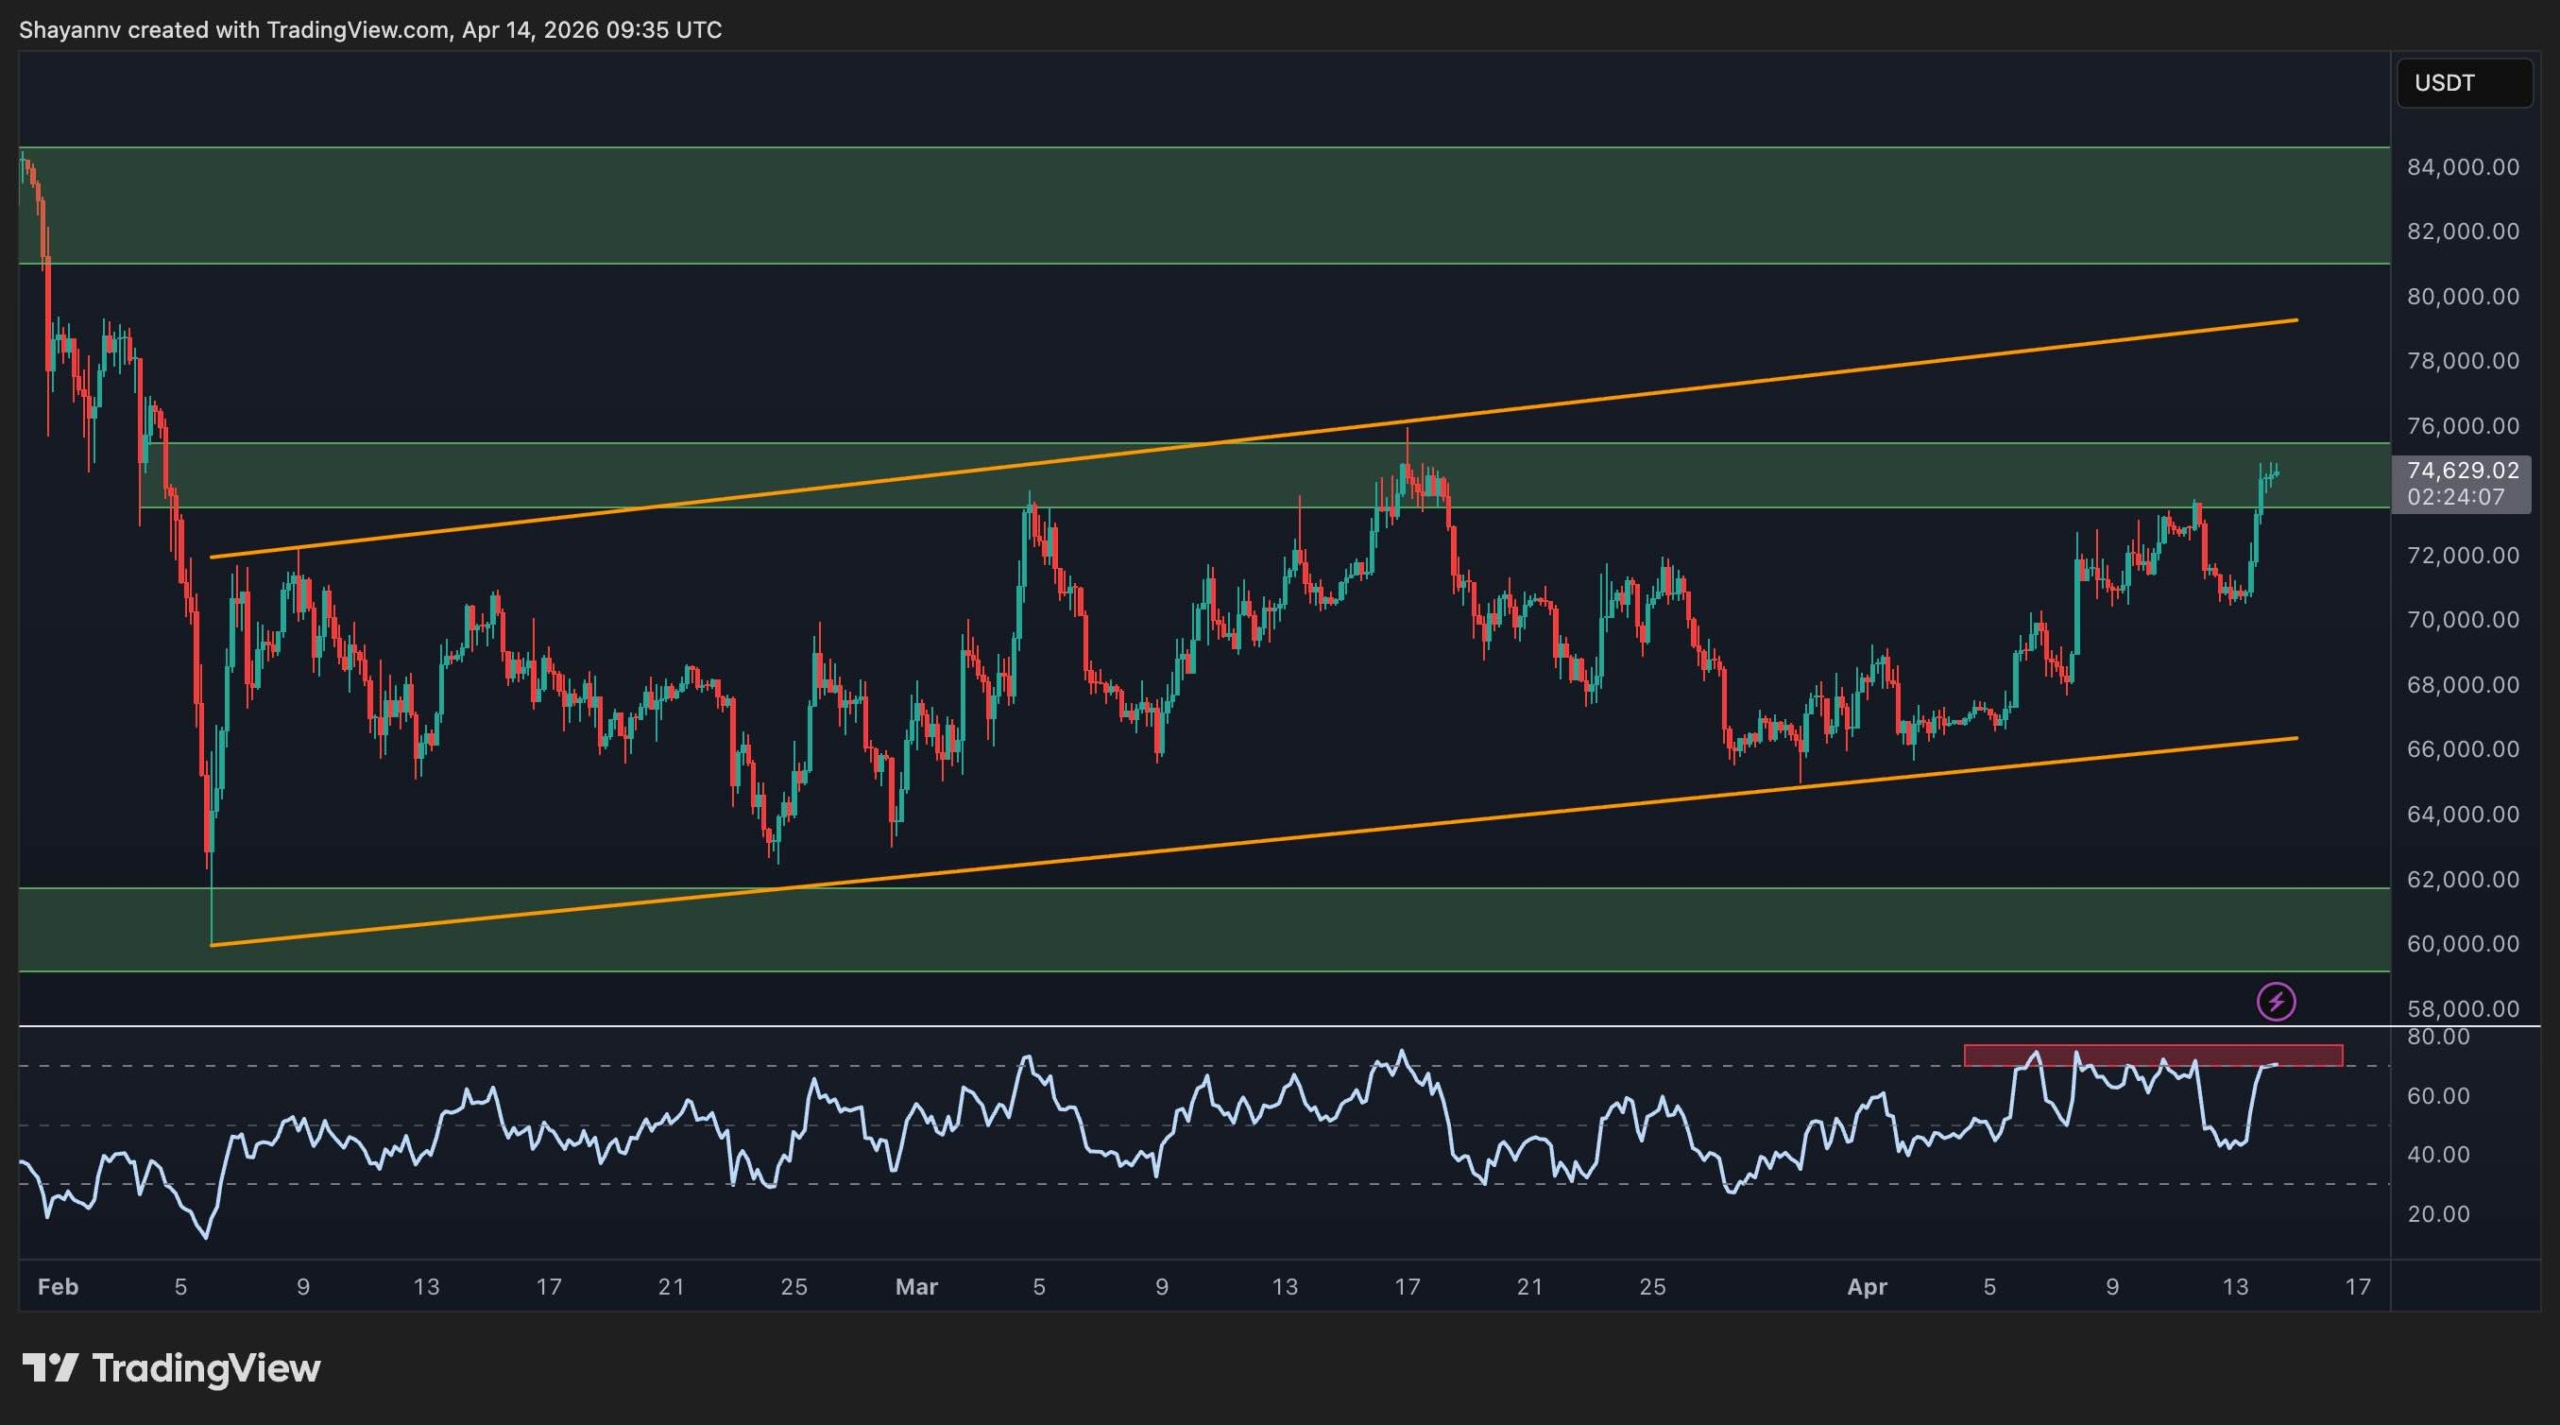
Looking at the 4-hour chart, Bitcoin has been steadily increasing in price since the February lows, moving within a slightly upward-trending channel. It’s now approaching the upper limit of that channel, around $80,000. This has brought the price into a resistance area between $74,000 and $76,000. The Relative Strength Index (RSI) has been consistently high for the past few weeks, indicating strong and ongoing buying pressure, not just a temporary jump.
Right now, the price needs to break above $74,000 to $76,000. If it does, it could then move towards the $80,000 to $82,000 range, signaling a positive change in the short-term trend. But if the price fails to climb and starts to fall instead, the first level to watch for support is around $66,000, with a stronger support level at $60,000 below that.
Sentiment Analysis
Although Bitcoin’s price has recently risen to around $74,600, traders are still largely betting against it. Funding rates – which measure the overall sentiment – remain significantly negative at around -0.015 and haven’t shown signs of improvement since the price started falling in February. This is a dramatic change from the previous year, when funding rates were mostly positive during the bull market. For the last two months, negative sentiment has consistently been the dominant trend.
What’s unusual right now is the difference between Bitcoin’s price increase and how traders are betting on its future. While the price has gone up from its recent low, most futures traders are still paying a premium to maintain bets that the price will go down. This suggests they don’t believe the price recovery will last.
The current strong belief that prices will fall is a double-edged sword. While it shows many people genuinely expect lower prices, it also makes the market susceptible to a sudden price increase if enough buyers emerge, especially if the price breaks above $75,000. However, until borrowing costs decrease and show consistent positive trends, the overall market sentiment remains unfavorable for those hoping for price increases.

Read More
- Brent Oil Forecast
- Silver Rate Forecast
- Gold Rate Forecast
- CNY JPY PREDICTION
- USD BRL PREDICTION
- ETH PREDICTION. ETH cryptocurrency
- Lobsters, AI, and Crypto Chaos: OpenClaw’s Wild Takeover
- Naughty Satoshi Hunt: NYT Names Adam Back, Back Says No
- Banks Dump $100 Billion Into Blockchain—But Your Grandma Still Can’t Buy Groceries With It
- Franklin Templeton’s Bold Leap into the Digital Age: Will it Pay Off?
2026-04-14 16:21