\n
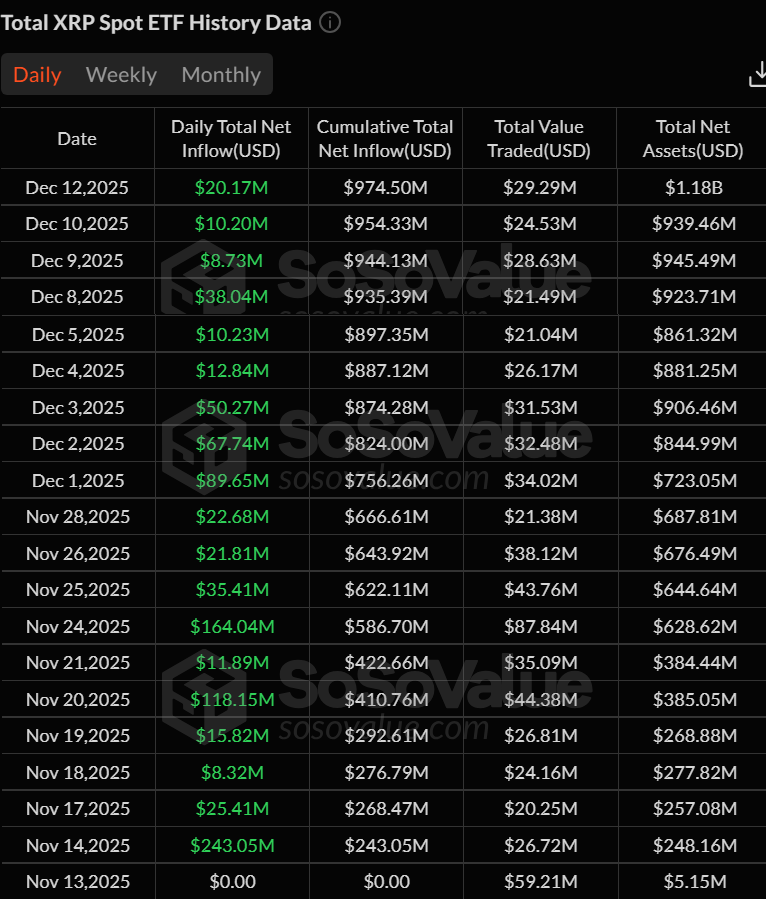
In the land where numbers dance and fortunes sway, Wall Street has developed a peculiar infatuation with XRP. Like a suitor who refuses to take no for an answer, US-listed spot XRP ETFs have achieved a streak of 19 consecutive trading days of net inflows 🌟. Not a single outflow session dared interrupt this romantic affair, as per the meticulous data compiled by Sosovalue.
\n\n
By December 12, the cumulative net inflows had swelled to a staggering $974.50 million, with total net assets hovering around $1.18 billion. Quite the dowry, wouldn’t you say?
\n\n
The Early Days: Where All the Magic Happened ✨
\n
The initial days carried the weight of this financial courtship. On November 14, a hefty $243.05 million flowed in, followed by another surge on November 24 ($164.04 million). November 20 and December 1 weren’t shy either, chipping in $118.15 million and $89.65 million, respectively. Even as the pace slowed, the inflows persisted-December 8 brought in $38.04 million, and December 12 added a modest $20.17 million. True love, indeed.
\n\n
\n\n
On X (formerly known as Twitter), Giannis Andreou, founder and CEO of Bitmern Mining, delivered the news with a flourish: “19 consecutive trading days of inflows. Zero outflow days. Nearly $1B in net capital added.” He dismissed the notion of retail froth, instead attributing this to “sustained institutional positioning.” Because, of course, institutions are far too sophisticated for froth 🧼.
\n\n
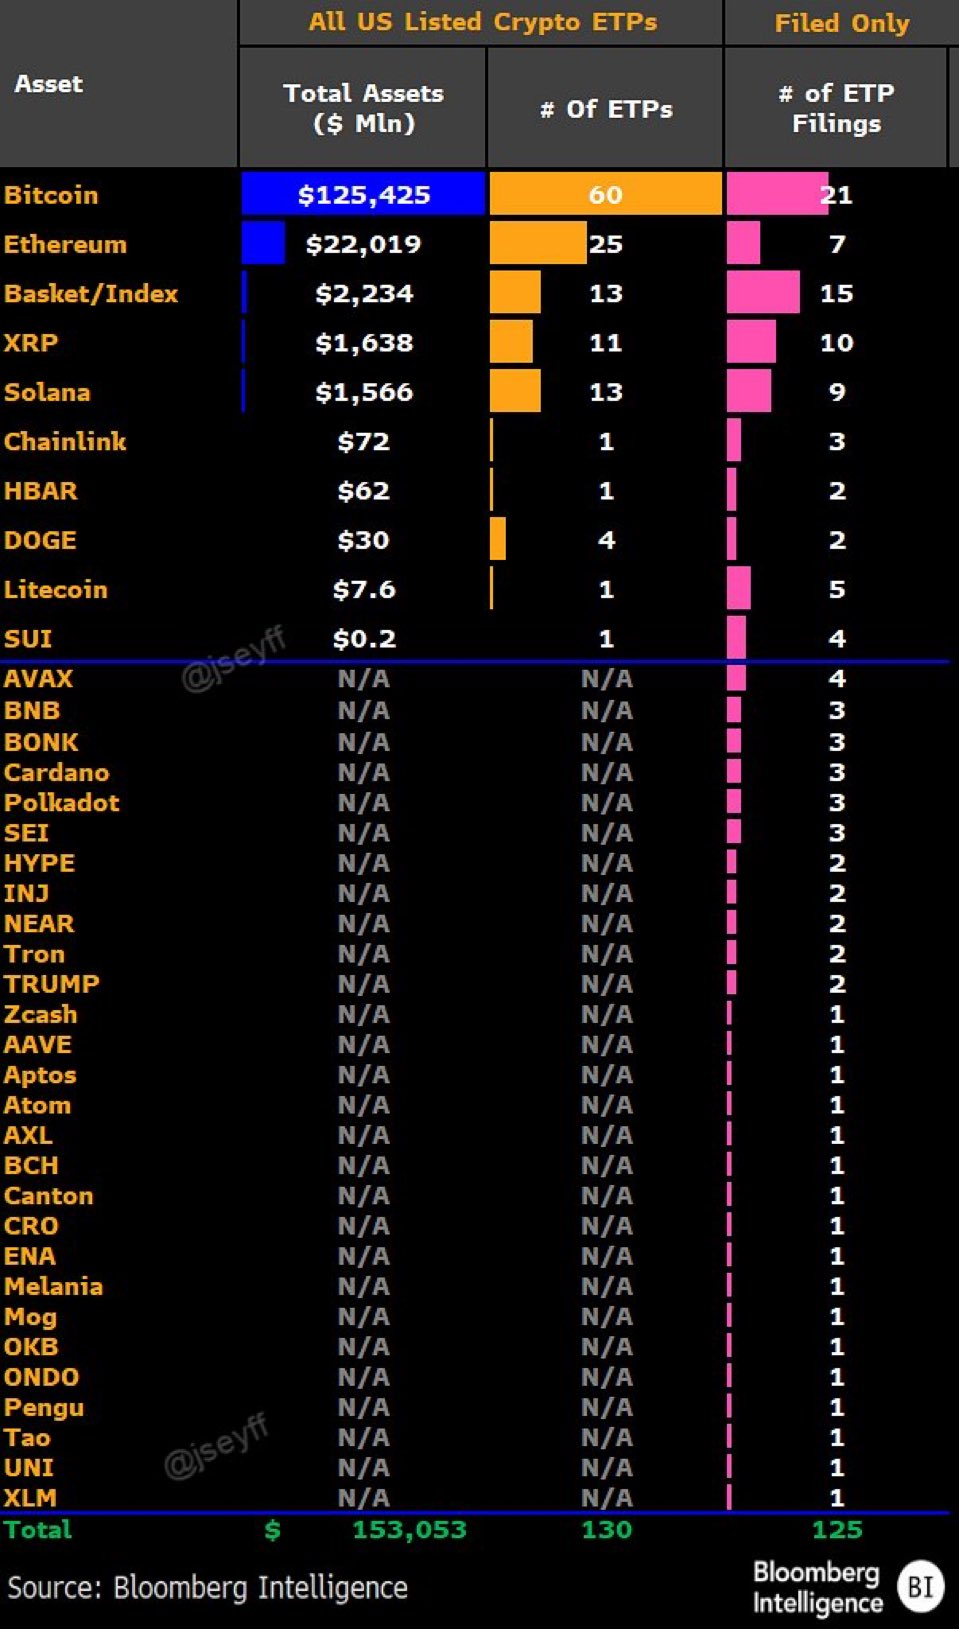
The “institutional bid” narrative also crept into asset rankings. Steven McClurg, CEO of Canary Capital, highlighted a snapshot of the US crypto ETP landscape, where XRP products are now nudging past Solana in total assets under management. The Bloomberg Intelligence chart places XRP ETP assets at approximately $1.638 billion, slightly ahead of Solana’s $1.566 billion. Bitcoin, meanwhile, remains the undisputed king at $125.425 billion, with Ethereum trailing at $22.019 billion.
\n\n
\n\n
McClurg’s explanation for this flip wasn’t about Solana underperforming but rather about where each asset “fits” in the wrapper trade. “SOL ETFs launched before XRP, but XRP ETFs have now passed SOL in total AUM. I expected this,” he wrote. He added, “SOL is much more efficient to hold on-chain and to stake directly for retail audiences, whereas XRP has more institutional demand and no staking. As with everything, there will be an audience that prefers direct ownership, and an audience that prefers the ease of financial instruments. Some will do both.”
\n\n
Notably, from December 8 to December 12, Bitcoin spot ETFs recorded net inflows of $287 million for the week, while Ethereum spot ETFs saw weekly net inflows of $209 million. SOL spot ETFs, meanwhile, managed a modest $33.6 million.
\n\n
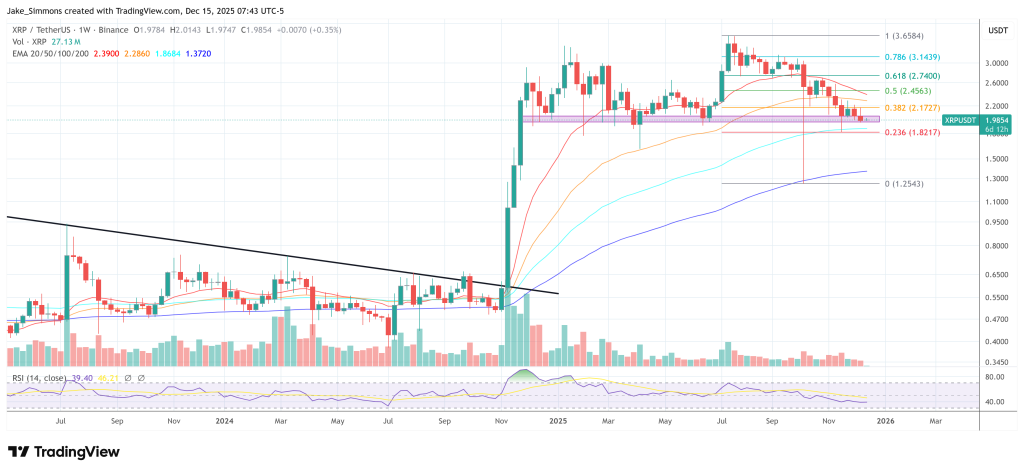
At press time, XRP flirted precariously below the $2 mark, trading at $1.98 and hovering at a key support zone. A dip below the red support band could strengthen the bearish argument for a deeper crash to the 100-week or even 200-week Exponential Moving Average (EMA). XRP visited the latter during the October 10 crash, proving that even the most fervent love affairs can face turbulence.
\n\n
\n
In the land where numbers dance and fortunes sway, Wall Street has developed a peculiar infatuation with XRP. Like a suitor who refuses to take no for an answer, US-listed spot XRP ETFs have achieved a streak of 19 consecutive trading days of net inflows 🌟. Not a single outflow session dared interrupt this romantic affair, as per the meticulous data compiled by Sosovalue.
By December 12, the cumulative net inflows had swelled to a staggering $974.50 million, with total net assets hovering around $1.18 billion. Quite the dowry, wouldn’t you say?
The Early Days: Where All the Magic Happened ✨
The initial days carried the weight of this financial courtship. On November 14, a hefty $243.05 million flowed in, followed by another surge on November 24 ($164.04 million). November 20 and December 1 weren’t shy either, chipping in $118.15 million and $89.65 million, respectively. Even as the pace slowed, the inflows persisted-December 8 brought in $38.04 million, and December 12 added a modest $20.17 million. True love, indeed.
On X (formerly known as Twitter), Giannis Andreou, founder and CEO of Bitmern Mining, delivered the news with a flourish: “19 consecutive trading days of inflows. Zero outflow days. Nearly $1B in net capital added.” He dismissed the notion of retail froth, instead attributing this to “sustained institutional positioning.” Because, of course, institutions are far too sophisticated for froth 🧼.
The “institutional bid” narrative also crept into asset rankings. Steven McClurg, CEO of Canary Capital, highlighted a snapshot of the US crypto ETP landscape, where XRP products are now nudging past Solana in total assets under management. The Bloomberg Intelligence chart places XRP ETP assets at approximately $1.638 billion, slightly ahead of Solana’s $1.566 billion. Bitcoin, meanwhile, remains the undisputed king at $125.425 billion, with Ethereum trailing at $22.019 billion.
McClurg’s explanation for this flip wasn’t about Solana underperforming but rather about where each asset “fits” in the wrapper trade. “SOL ETFs launched before XRP, but XRP ETFs have now passed SOL in total AUM. I expected this,” he wrote. He added, “SOL is much more efficient to hold on-chain and to stake directly for retail audiences, whereas XRP has more institutional demand and no staking. As with everything, there will be an audience that prefers direct ownership, and an audience that prefers the ease of financial instruments. Some will do both.”
Notably, from December 8 to December 12, Bitcoin spot ETFs recorded net inflows of $287 million for the week, while Ethereum spot ETFs saw weekly net inflows of $209 million. SOL spot ETFs, meanwhile, managed a modest $33.6 million.
At press time, XRP flirted precariously below the $2 mark, trading at $1.98 and hovering at a key support zone. A dip below the red support band could strengthen the bearish argument for a deeper crash to the 100-week or even 200-week Exponential Moving Average (EMA). XRP visited the latter during the October 10 crash, proving that even the most fervent love affairs can face turbulence.
Read More
- CNY JPY PREDICTION
- USD CNY PREDICTION
- USD BRL PREDICTION
- EUR PHP PREDICTION
- USD RUB PREDICTION
- CNY RUB PREDICTION
- Brent Oil Forecast
- Silver Rate Forecast
- EUR USD PREDICTION
- USD JPY PREDICTION
2025-12-16 05:17