Despite maintaining its long-term base near $0.30, the broader setup signals weak momentum and sustained selling pressure across spot and derivatives markets. 💸🔥
Analyst Outlook: Predicts Multi-Stage Rebound Setup
Crypto analyst @PROGWORX shared a bullish projection for XLM/USDT, suggesting that the token may be forming a multi-stage recovery structure after its recent retracement. His chart highlights a potential short-term consolidation near $0.30, followed by an upward breakout that could drive prices toward $0.38-$0.40 in the coming sessions. 🧙♂️💸
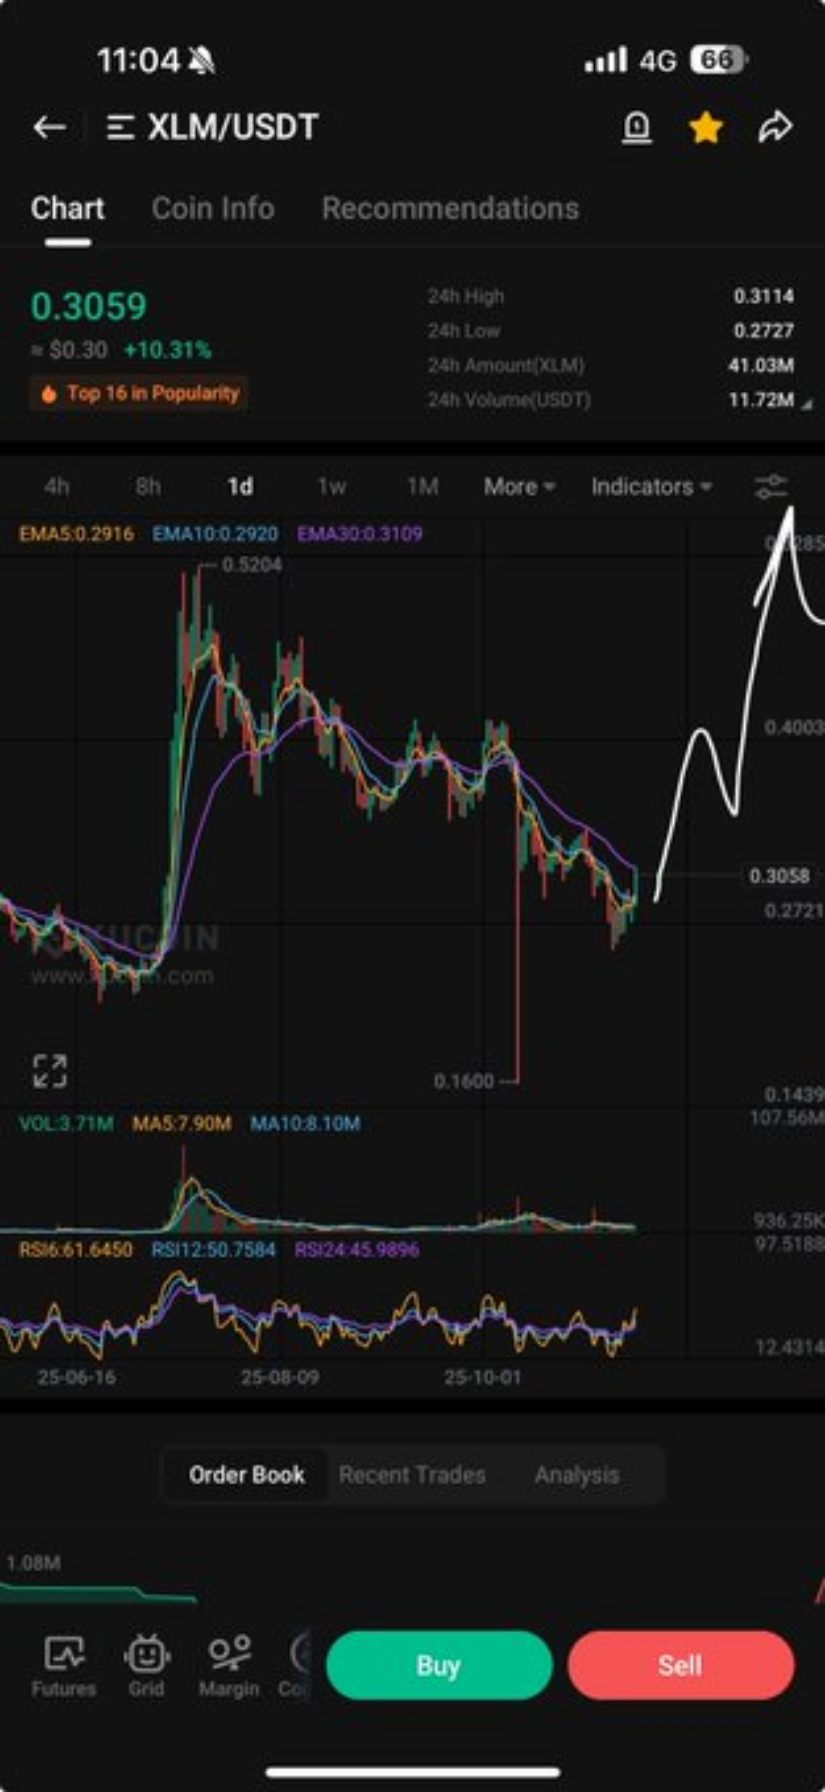
The analyst’s view hinges on sustained accumulation near the moving average clusters-specifically the EMA50 ($0.2916) and EMA100 ($0.2920)-which currently act as pivot zones. A confirmed breakout above the EMA200 region (~$0.31) could trigger momentum-driven buying, accelerating the next leg higher. 🚀📈
This bullish structure suggests that the coin is transitioning from reactive selling to a gradual accumulation phase, similar to earlier recovery patterns seen in Q2 2025. 🔄💡
Market Data Shows Moderate Decline in Market Metrics
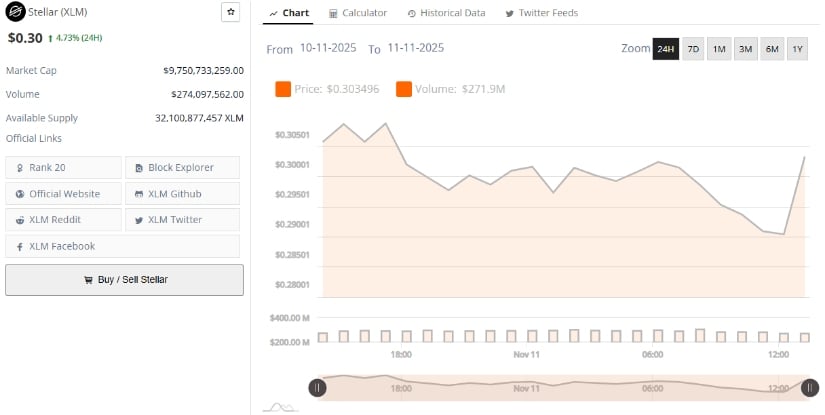
Stellar has staged a notable recovery this week, climbing to $0.30, marking a 4.73% gain over the past 24 hours, according to market data. The asset currently commands a market capitalization of $9.75 billion, supported by daily trading volume of over $274 million. This rebound follows a sharp correction phase that saw the coin dip toward $0.27, where buyers appear to have re-established support. 💰😂
The coin’s recent momentum has elevated it to one of the better-performing mid-cap assets on the day, with renewed participation from both retail traders and institutional desks. The next key test lies in whether the token can sustain above $0.30 and challenge the psychological resistance at $0.32-$0.34, a level closely watched by technical traders. 📈👀
Derivatives Snapshot: Open Interest Continues to Normalize
Futures market data from Coinalyze shows that open interest in the coin has declined modestly to around $68.67 million, following a steady drop from early-November peaks near $80 million. This contraction in OI during a price rebound often reflects reduced speculative leverage and a shift toward more stable, spot-driven demand. 🛌🎲

In technical terms, this reduction in OI can act as a “reset,” allowing the market to rebuild positioning on firmer ground. Should OI begin to rise again alongside price strength above $0.31, it would confirm the return of bullish momentum and potentially support a rally toward $0.35-$0.40. 🚀🕊️
Market participants are monitoring whether this OI-price divergence continues, as a flattening OI during rising prices often precedes a sustained bullish phase. 🔄📈
Read More
- Gold Rate Forecast
- GBP USD PREDICTION
- USD ARS PREDICTION
- USD RUB PREDICTION
- ETH PREDICTION. ETH cryptocurrency
- Brent Oil Forecast
- FIL PREDICTION. FIL cryptocurrency
- USD ILS PREDICTION
- USD TRY PREDICTION
- Silver Rate Forecast
2025-11-12 01:51