Alright, so Hyperliquid’s floating around that “big move” zone. You know, that nice little tricky area between $42 and $48 – because who doesn’t love a good rollercoaster, right? After weeks of zig-zagging, everyone’s got an opinion: “It’s breaking out!” or “Nah, it’s just another dip, relax.” 💼📉
Hyperliquid Price Volatility & Long-Term Trend
So it’s sitting at $45.04, up a modest 3.33% today. Big deal. The chart? Oh, it’s just dancing between $42 and $48 – classic volatility; the crypto version of “Are we there yet?” While support’s been tested at $44, sellers are lurking closer to $48. Surprise! 😲
Technically, the long-term looks okay – if you squint. The $40 level’s holding, which keeps the dream alive. Break $48? Oh boy, then maybe, just maybe, we hit $50 or even beyond $60. Crazy talk? Nah, just the usual crypto optimism. 🚀
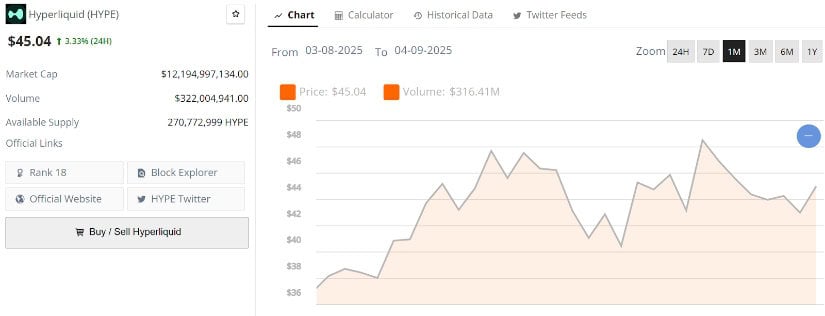
Market cap: $12.1B. Daily volume: over $322M. Basically, liquidity’s thick enough to swim in, so as long as buyers stay excited, this thing’s got a shot to keep cruising.
August Revenue Jump Adds Confidence to HYPE
August was a good month – hypermarket revenue shot past $100 million. Yep, a 23% jump from July. Because nothing says “I’m confident” like nearly $400 billion in perpetual trading volume. They’re eating up competitors’ lunch, and people are eating it up too. Yo, we’re watching you, FOMO! 🍽️📈

All this sounds positive, right? Well, sure, but the chart? It’s kind of like a “Will it or won’t it?” dance. Price stuck between $42 and $48, just hanging out. If it can break through $45.50, boom! Up past $49, heading for the $50-$60 zone. But don’t get your hopes too high – remember, bears and divergences are lurking. 🐻
Hyperliquid Technical Analysis
The $44-$45 zone is the “big pivot.” Bulls need to push past that threshold – easy, right? Hold on, just below $45.50 now, which is the resistance to watch. Break it? Good. Fail? Then back to the drawing board – maybe down to $42 or $40. Nothing like a good support test to keep us on our toes. 🤨

If bulls can hold above $45.50? Well, cozy up! We might just get to $49 or $50 – a nice little ceiling to break if things go right. Fundamentals are looking decent, so maybe, just maybe, we get a rally again. Or not. Typical crypto drama. 🎢
Contrary View: Bulls Must Clear $50 to Avoid Losing Momentum
Now, not everyone’s on the hype train. Some analysts? They see trouble brewing. There’s a “bearish divergence,” a fancy way of saying momentum’s slowing down even though the price isn’t tanking just yet. If it can’t crack $50? Uh-oh. Eliminating that level might mean heading south, all the way to $30-$35. Lovely. 💸🙄
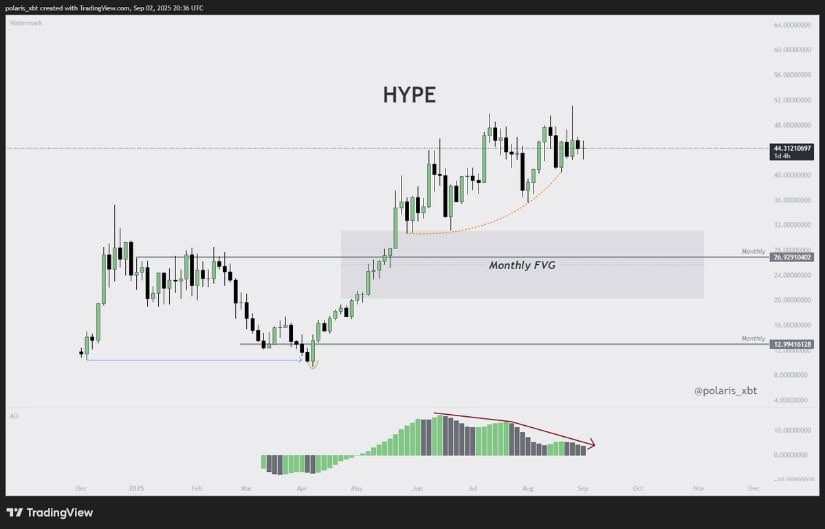
So if the divergence plays out, it could mean trouble. Watch out for that little red flag, folks. Fundamentals are decent, but the charts? They’re throwing some shade. ☂️
Final Thoughts
This is a tricky one. On paper, lots of good stuff: revenue’s up, liquidity’s strong, support levels are holding. But it’s all a question of whether buyers can push past resistance or if the bears will just sit on their hands and wait for a better moment to pounce.
-
Bullish Scenario: Break $45.50, confirm above $48, push for $50-$60. Easy! 🚀
-
Bearish Scenario: Fail to clear $50, and you’re headed down to $30-$35. Fun times! 😅
Yeah, so, it’s a waiting game now. Will the buyers get loud enough to break out? Or will those pesky divergences spoil the party? Stay tuned, it’s gonna be a wild ride. 🤷♂️
Read More
- Gold Rate Forecast
- Brent Oil Forecast
- Silver Rate Forecast
- CNY JPY PREDICTION
- USD CNY PREDICTION
- PEPE PREDICTION. PEPE cryptocurrency
- Citi’s Crypto & AI Uprising: Will Your Portfolio Survive? 🚀
- BTC PREDICTION. BTC cryptocurrency
- Bitcoin Rockets Past $70K-Bears Panic, FOMO Parties, And Trump Weighs In
- ETH PREDICTION. ETH cryptocurrency
2025-09-03 23:55